Young Australians are repeatedly told Australia needs high migration to help them pay for an ageing population in coming decades. More migrants mean more workers to share the rising cost of health and aged care.
But that’s not the full story. More migrants also mean more people. They need roads, railways, schools, hospitals, electricity, water, and other infrastructure. All that must be built and paid for too.
I described this trade-off in a previous article for The Spectator Australia. High migration would likely curb how much Australians pay to look after more old people but increase how much they pay to build for more migrants. Lower or zero migration would likely have the opposite effect.
Both sets of costs matter. Yet when our leaders argue that Australia needs high migration to help look after an ageing population, we hear a great deal about the first, but not so much about the second.
That means high migration is often presented as an economic imperative, not a policy choice. But if we put both costs on the same page, we can see the choice more clearly.
In this article, I describe a spreadsheet I have built that compares the cost of caring and the cost of building under two very different migration scenarios. It produces some interesting numbers, but more importantly, it provides a framework to analyse and show the trade-off between these costs. I think our leaders should provide similar analysis.
A clearer presentation of how costs vary with higher or lower migration would not only help young Australians assess the economic trade-off. It would also help them decide what kind of country they want to live in.
Two demographic futures
Consider two possible futures for Australia.
Treasury’s latest Intergenerational Report (IGR) projects that Australia’s population could rise from around 28 million now to around 39 million in 2065-66 if net overseas migration is set at 235,000 each year. If we chose zero net overseas migration, the Australian Bureau of Statistics estimates that the population could fall to around 26 million by then.
That’s a big difference. So, which scenario would be more expensive for the people paying the bills?
You might think the IGR would answer that question. But it doesn’t.
The IGR forecasts Commonwealth spending on health and aged care, but not state spending. And its analysis of infrastructure is limited to a relatively small program. Moreover, the IGR does not consider a zero-migration scenario.
This means that the IGR does not provide full estimates of public spending on key items across a wide range of migration scenarios. As far as I’m aware, no other official analysis does that either.
So, I have tried to do that.
The Care Bill and the Build Bill
My spreadsheet compares public spending on health and aged care with public investment in infrastructure under two migration scenarios – the IGR’s baseline-migration scenario, and a zero-migration scenario. It covers the 40 years from 2026-27 to 2065-66 projected in the IGR. Full details are shown in an article posted on my Substack page.
The model estimates or calculates the share of GDP for each type of spending. It then uses IGR projections for inflation-adjusted GDP and the labour force to calculate and derive the amount spent in each category in each year over this period. Finally, it divides each year’s spending by the size of the labour force in that year and then aggregates those figures over the forty years.
I call the resulting figures the Care Bill and the Build Bill. Adding them together gives the Combined Bill. These are not literal tax bills, but they provide a measure of cumulative public expenditure for individual members of the labour force over the 40-year period.
For the baseline-migration scenario, I estimate the Care Share – public health and aged care spending as a percentage of GDP – using figures from the IGR and the Australian Institute of Health and Welfare. This increases from 8.35 per cent in 2025-26 to 12.90 per cent in 2065-66.
The Build Share – infrastructure spending as a percentage of GDP – is held constant at 4.85 per cent. This number reflects the cost of replacing existing infrastructure and expanding capacity to accommodate population growth. It is derived from analysis by population researcher Dr Jane O’Sullivan in a submission to the Productivity Commission.
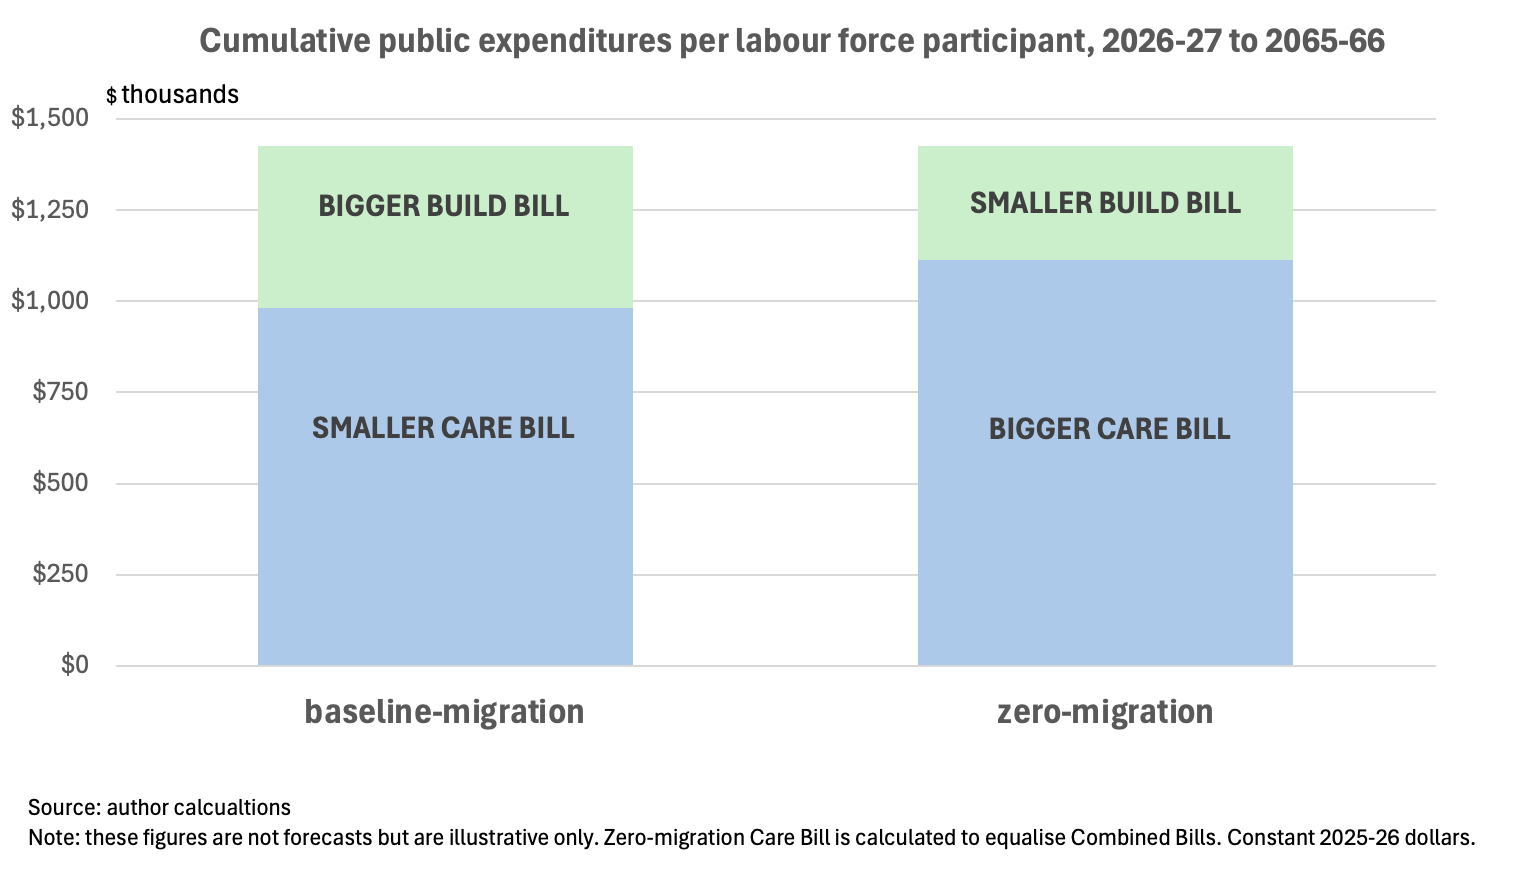
These assumptions and estimates yield a Care Bill of $981,000 per worker over the 40 years. The Build Bill comes to $445,000. Together, they produce a Combined Bill of $1.43 million per worker.
The IGR does not include zero-migration projections. For that scenario, I again assume the Build Share is constant, but at 3.4 per cent of GDP, reflecting only the replacement cost. That gives a Build Bill of $312,000. The key difference is how I estimate the Care Share.
I don’t. Instead of estimating that number, I calculate it.
Breaking even
Rather than forecast how zero migration will impact health and aged care spending, I ask a simpler question – how big would the Care Bill have to be to offset the smaller Build Bill in that scenario so that the Combined Bill is equal in both scenarios?
The answer to that question is given by a number for the Care Share. My spreadsheet calculates that if the Care Share reaches 15.98 per cent in 2065-66 under the zero-migration scenario, the zero-migration Care Bill will be $1.11 million. That would mean that the Combined Bill is $1.43 million per worker under both scenarios.
I’m not predicting. I’m depicting.
That 15.98 per cent number is a break-even calculation, not a forecast. It is about three percentage points higher than 12.90 per cent, the estimate for the baseline-migration Care Share in 2065-66. As the following chart shows, that number means that the higher Build Bill under the baseline-migration scenario is exactly offset by a higher Care Bill under the zero-migration scenario. The Combined Bills are therefore equal by construction.
Is a zero-migration Care Share of 15.98 per cent in 2065-66 plausible? I don’t know. That’s not the purpose of this exercise. This exercise aims to show how we could end up with the same Combined Bill in both scenarios as an illustration of how the two sets of costs can offset each other.
But our leaders should be able to answer that question.
The question our leaders should answer
I’m just some bloke with a spreadsheet, making a few assumptions. Comprehensive forecasts of the costs of caring and building for different population trajectories would require detailed demographic, economic and fiscal modelling.
But we have several agencies with the expertise and resources to do this – that includes Treasury, the Productivity Commission, Infrastructure Australia, and the ABS.
These agencies publish some information about how various costs vary with population growth. But, to my knowledge, they do not provide a full analysis of the trade-offs across a wide range of migration scenarios. Our leaders could direct them to do so.
This matters because these costs shape the debate on migration.
When our leaders talk about Australia’s future, they often argue that we will need many more migrants to help look after the many more old people who will be living here. It is implied, or even explicitly stated, that high migration is the only responsible way to deal with rising health and aged care costs in an ageing society.
But looking at just one set of costs is obviously incomplete. As my spreadsheet indicates, infrastructure costs could offset, match or outweigh higher health and aged care costs at different levels of migration. So, let’s have both sets of costs properly analysed and clearly presented.
And once we have that, we are also in a better position to assess other factors.
The choice is about more than the cost
Different levels of migration not only entail different costs. They each deliver a different Australia.
Higher migration, on one hand, might mean a smaller Care Bill and a bigger Build Bill. It would also probably mean a more culturally diverse country and more high-density housing in our cities.
Lower or zero migration, on the other hand, might mean a bigger Care Bill and a smaller Build Bill. It would also probably mean a less culturally diverse country and less need for more high-density housing in our cities.
When Australians have a clearer understanding of the relative costs of different migration levels, they can also assess other factors. Some people might highly value a more diverse society. Others might care more about living in a city where most families can have a backyard. And even if one scenario turned out to cost more than another, Australians might reasonably prefer it for other reasons.
Young Australians, in particular, deserve to have this information. They will not only be working and paying for what Australia needs over the next forty years – they will be voting too. To make informed decisions about Australia’s future, they need to understand the cost of different options.
My spreadsheet provides a framework for doing that. It’s time our leaders put both bills on the same page.