As the years pass since the 2015 Paris climate conference made Net Zero by 2050 the global elite’s Holy Grail, it looks increasingly dubious.
Chris Kenny, journalist for The Australian and Sky News Australia, makes the point that according to the International Energy Agency, ‘Half the emission reductions needed to reach Net Zero come from technologies not yet on the market.’ That is, Kenny emphasises, it’s impossible with current technology.
Canadian engineering polymath Professor Vaclav Smil recently considered how we’re doing, halfway between the 1997 Kyoto Protocol and 2050 when we’re supposed to achieve Net Zero:
All we have managed to do halfway through the intended grand global energy transition is a small relative decline in the share of fossil fuel in the world’s primary energy consumption – from nearly 86 per cent in 1997 to about 82 per cent in 2022. But this marginal relative retreat has been accompanied by a massive absolute increase in fossil fuel combustion: in 2022 the world consumed nearly 55 per cent more energy locked in fossil carbon than it did in 1997.
Smil’s engineering mind ponders the massive scale of the changes required in the mere 25 years or so from now to 2050. For example, this would involve replacing billions of machines powered by fossil fuels, everything from power generation to cars, trucks, airplanes, and ships; to tractors, irrigation pumps, and industrial processes including steel, chemicals, glass, concrete, bricks, paper, and more. On the face of it, says Smil, and even without performing any informed technical and economic analyses – which he goes on to do – this seems to be an impossible task.
I’m going to look at this from another angle. Simple arithmetic and some data. The simple arithmetic is this. To reduce emissions from any given level in a straight line to zero in 25 years involves emissions reduction at the initial annual rate of 4 per cent (1/25, expressed as a percentage). Now let’s compare this to the data on emissions reductions. I’ll use Energy International’s Statistical Review of World Energy 2023, which includes data on carbon dioxide emissions from fossil fuels and industry.
Global emissions from fossil fuels and industry increased at an average rate of 0.7 per cent per year between 2012 and 2022. The OECD countries achieved reductions of 0.7 per cent, offset by growth in the non-OECD countries of 1.6 per cent. The OECD countries now account for less than a third of emissions; the non-OECD countries more than two-thirds. We are a very long way from the 4 per cent a year reduction rate. The OECD countries, supposedly leading the way, are themselves falling short by more than a factor of five.
The only year global emissions declined was 2020 when they retreated by 5 per cent under the Covid lockdowns. They have now advanced again beyond the 2019 levels. An unprecedented, near-global lockdown in response to Covid provides a sense of the scale of what’s involved in global emissions reductions on the order of 4 per cent or more. And that was just one year; to reduce by a further 4 per cent (or more) year after year is much more difficult again.
Two substantial countries have exceeded the 4 per cent reduction rate. Ukraine is the best – I use the term ironically. Russia annexing parts of the country, invading, waging war, and destroying Ukraine’s infrastructure has delivered emissions reductions that averaged 9.2 per cent a year from 2012 to 2022. Next best is Venezuela at an average annual rate of emissions reduction of 6.3 per cent since 2012, the result of hyperinflation and economic collapse under the Maduro socialist government. Millions of people have left the country, and most of those who’ve stayed are short of food, some desperately so. Yet we never hear Venezuela lauded as an exemplar of emissions reduction.
Some countries have come close to achieving the 4 per cent reduction target. Greece managed to achieve an average annual emissions reduction rate of 3.5 per cent, courtesy of its debt crisis and the economic austerity measures imposed on it following the Global Financial Crisis.
The UK and Denmark have achieved average annual reductions of 3.8 per cent and 3.5 per cent respectively from 2012 to 2022. Denmark is a relatively small country of about 6 million people that, as Vaclav Smil notes, has little heavy industry and balances its wind energy generation with electricity imports from neighbouring countries. The UK has continued its long-term de-industrialisation, closed coal-fired power stations, converted the huge Drax power station from coal to imported wood pellets (rated as zero emission), increased gas-fired generation and wind power, and increased electricity imports from Europe, mainly from nuclear-powered France.
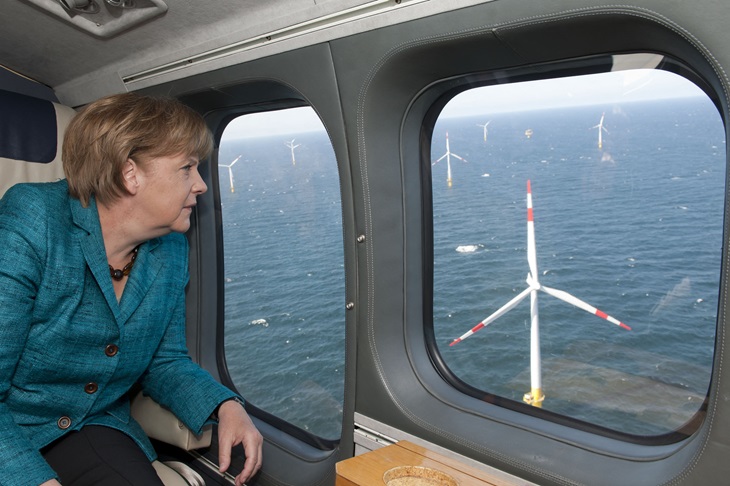
Germany, which championed its 2010 ‘Energiewende’ and has spent big on renewables and closed its nuclear plants, only achieved average annual reductions of 1.9 per cent between 2012 and 2022.
The European Union, overall, reduced emissions at an average annual rate of 1.6 per cent. A populist backlash has been developing since the French donned yellow vests in 2018 to protest proposed fuel tax increases, exposing broad frustration from regional and working-class France against the agendas of the Paris elite exemplified by President Emmanual Macron. His party lost its ruling majority in the National Assembly following the 2022 elections. In the Netherlands, the Farmers and Citizens Movement (BoerBurgerBeweging, or BBB) was founded in 2019 and won the 2023 provincial elections. Farmers have staged tractor blockades demonstrating against draconian nitrogen and emissions-reduction laws. In the UK, the government has retreated from the timetable to ban internal combustion engine cars and gas boilers, and there is widespread hostility to low-traffic neighbourhood initiatives, so-called ‘15-minute city’ initiatives, and London’s expanded Ultra Low Emissions Zone (ULEZ). Meanwhile, Germany is de-industrialising, going into recession in 2023. The 2024 European Parliament elections are expected to see populist parties gaining votes and seats and centre-left and green parties losing votes and seats.
Outside Europe, Japan is a relatively good performer, with average annual emissions reductions of 1.9 per cent. Australia and Canada are reducing emissions from fossil fuels and industry at an average annual rate of 0.2 per cent, with the USA doing slightly better at 0.3 per cent.
The non-OECD world is a different story, with most countries increasing emissions as they develop, some rapidly. Emissions in Vietnam are growing at 7.5 per cent, in Bangladesh 6 per cent, the Philippines 5.5 per cent, Eastern Africa 4.5 per cent, Iraq 4.2 per cent, India 3.6 per cent, and Indonesia 3.3 per cent.
There is no prospect that this will change in the coming years or decades. Because there is a vast gulf between the rich and the poor countries in terms of energy consumption per capita. The world average is 76 GJ per person per year. For the OECD countries, energy consumption per capita is 170 GJ, while in the non-OECD countries it’s only a third of that, 57 GJ – think Algeria at 55 GJ or Brazil at 62 GJ. But these averages hide even starker contrasts. The African average is just 14 GJ per person per year. For Australia, it’s 228 GJ and the USA at 283 GJ is 20 times the African average. Most of the Arabian Gulf oil states are much higher still. The poorer countries of the world have a long, long way to go. Konstantin Kisin made the point in his remarkable Oxford Union speech: ‘You are not going to get these people to stay poor.’
This simple arithmetic and a look at the data confirm that Vaclav Smil is right:
Complete decarbonisation of the global economy by 2050 is now conceivable only at the cost of unthinkable economic retreat, or as a result of extraordinarily rapid transformations relying on near-miraculous technical advances.
Net Zero by 2050 is either a fantasy, or a covert agenda of the global elite for eco-imperialist mass impoverishment.
Dr Michael Green has a PhD in Systems Engineering.