Given that lockdown was very nearly ordered on the advice of Sage last month, it’s worth keeping an eye on the ‘scenarios’ it published, and how they compare to the situation today. Another week of data offers more food for thought. This week was the period when deaths were supposed to be peaking – so given that no extra restrictions were ordered, it’s interesting to compare the peak the models predicted for this week with what actually happened.
- Deaths were said by Sage to peak at anything from 600 to 6,000 a day (the latter figure, predictably, hogged the headlines). But on Saturday 262 deaths were reported in England, and the ONS indicates that a potentially large proportion of these were those who died from other causes but also happened to have Covid.
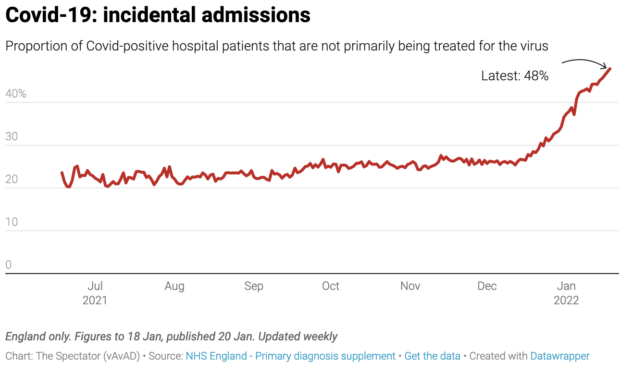
- Hospitalisations were to peak between 3,000 to 10,000 a day. But yesterday there were 1,698 hospital admissions and 14,320 patients in hospital (12 per cent fewer than last Saturday). We also know that about half of these patients are being primarily treated for something else, but also happen to have Covid.
- The number of Covid patients in intensive care has fallen to a six-month low.
Sage has since issued updates, which do address the important issue of why its original advice was so out of the ballpark. But before we turn to that, let’s look at the various models – which may well have led Chris Whitty to tell the public on 15 December that everything we know about Omicron ‘is bad.’ At the time, real-world data from South Africa had already shown Omicron to be far milder and less likely to lead to death and requiring intensive care. Given this data, how did the Chief Medical Officer come to be so badly informed about such an important point? What charts was he looking at?
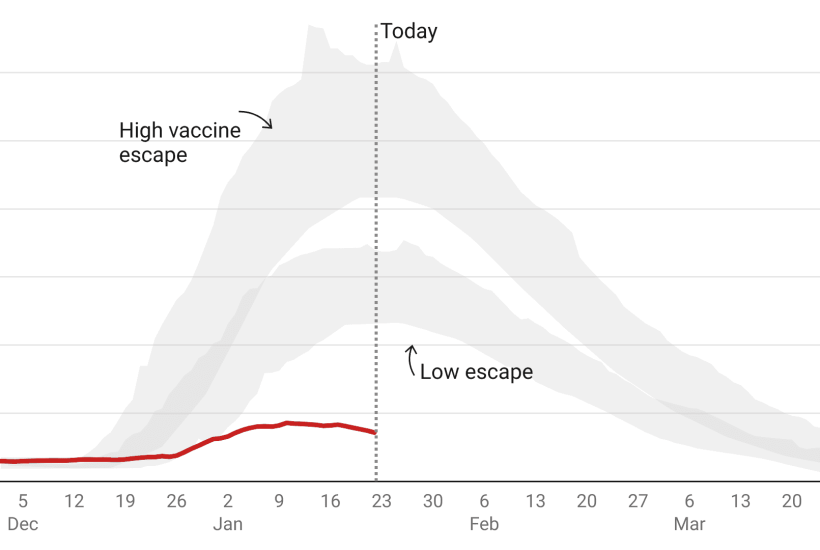
LSHTM: beds occupied by Covid patients
The London School of Hygiene & Tropical Medicine (LSHTM) ought to be taken very seriously: it’s the university of Prof Graham Medley, who chairs the Sage modelling committee.
The below is what LSHTM published on 19 December, just before the crunch cabinet meeting when the government decided not to impose restrictions. It shows that by around 22 Jan Covid beds occupied would be between 45,000 and 70,000 on the ‘low escape’ scenario. This was far above last winter’s peak. In the ‘higher escape’ scenario, Covid beds occupied was 80,000 to 120,000, far above the actual capacity of the NHS. But in reality beds occupied in England peaked at 17,120 on 10 January and have been steadily falling since.
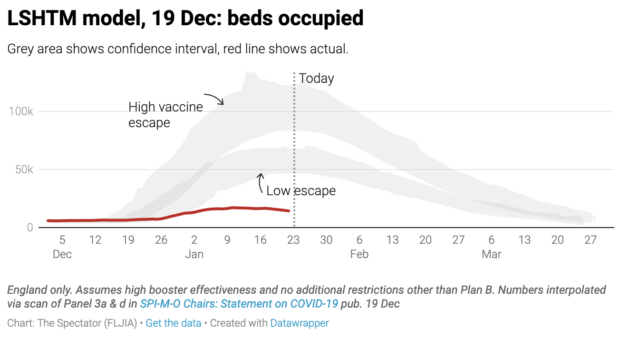
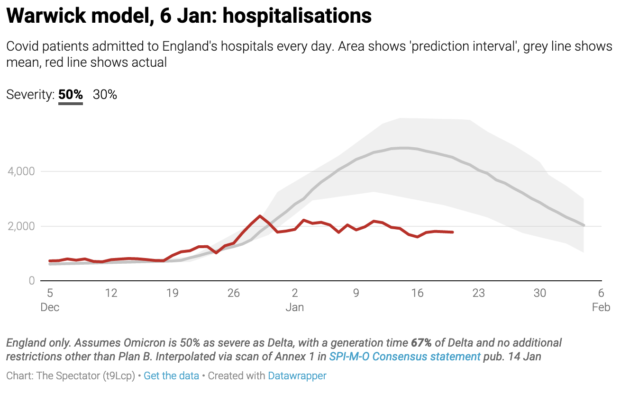
Warwick hospitalisations
Warwick’s 50 per cent severity scenario suggested hospitalisations should have peaked at around 14,000. In reality this barely passed 2,000. The Warwick scenario which best tracked actual hospitalisations was the one which assumed Omicron is 10 per cent as severe as the Delta variant. But no one argues that Omicron is this mild. The latest updates from the UK Health Security Agency (UKHSA) suggest that Omicron is about half as severe as Delta. Something else skewed Warwick’s figures.
Warwick deaths
Daily deaths are well below even the 10 per cent Warwick scenario. We don’t display the last five days of data because the numbers are often revised upwards but on 16 January there were 215 deaths compared to around 500 predicted by Warwick’s model. And let’s remember that a percentage of these deaths are ‘with’ rather than from Covid.
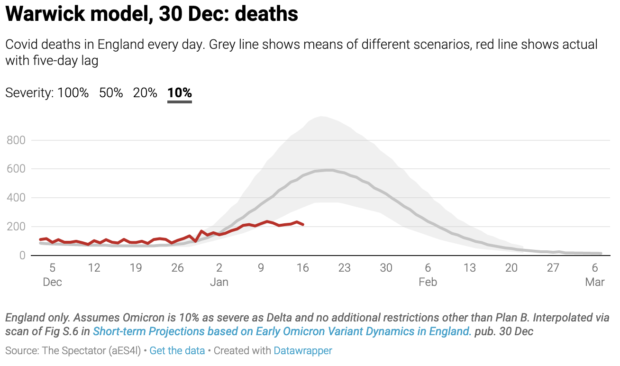
The true number of Covid deaths is likely to be considerably lower than this. Just as Omicron has caused ‘incidental admissions’ to shoot up there will be many people who died of something other than Covid but happened to have Covid at the time. ONS data reveals that over the course of the pandemic 17,371 deaths were recorded where Covid was the sole cause. This does not suggest that the Covid death toll has been massively distorted: Covid is lethal because it kills people with complicated health situations who would otherwise have survived. From the get-go, we knew that most Covid patients on the ICU wards had other complications: this doesn’t make it less of a killer.
Do we know more about what went wrong in the modelling?
So what went wrong? The error margin of pandemic modelling is monstrous because there are so many variables, any one of which could skew the picture. Indefensibly, Sage members are under no obligation to publish the code for their models, making scrutiny harder and error-correction less likely. The outside world has no means of knowing why Warwick and LSHTM ‘scenarios’ were so far out. Given how much is riding on these models, complete transparency – to parliament and the public – should be a prerequisite of Sage membership.
But from what we gather so far, the big assumption that skewed the Sage models was the ‘generation time’ of Omicron: i.e. the time it takes for someone to become infected and then pass it on to someone else. The shorter it is, the more effect restrictions have.
Sage has met twice since the new year and both SPI-M-O papers presented at those meetings have started to explain why previous modelling was so off the mark. The first of these papers dedicates around half of its analysis to generation time. ‘These results show that models where Omicron’s generation time is assumed to be the same as Delta’s show a poor fit to the post-Christmas data’ they say. A ‘poor fit’ is putting it politely.
But the modellers were aware of the potential effects of a shorter generation time very early on. On the 8 December SPI-M minutes said ‘a shorter mean generation time will mean an R closer to 1.’ But in all of the modelling presented that month the researchers assumed Omicron’s generation time was the same as Delta’s.
Was there any real-world data already suggesting Omicron could have a shorter generation time? Yes. Scientists were discussing the possibility of a shorter generation time as soon as Omicron’s faster transmissibility was observed. UKHSA officials confirmed it made biological sense. The 8 December SPI-M-O ‘consensus statement’ even said: ‘As Omicron’s doubling time appears to be so fast, this could imply a quicker generation time than Delta.’ This wasn’t confirmed until a South Korean paper was published on Christmas day, but given that it was a distinct possibility why wasn’t it modelled?
Models are hugely dependent on inputs and parameter weightings. Changes to these ‘settings’ can drastically impact model outputs. The full Sage minutes (the document that ministers are briefed on) before the crucial December cabinet meeting made only a cursory mention of Omicron’s generation time to say it could impact Test and Trace. ‘The generation time […] is not known, but it is possible that it is shorter than for Delta, which would mean that case-based interventions (e.g. finding and isolating cases through contact tracing) become less effective because people become infectious sooner.’ It didn’t emphasise that a differing severity and generation time could render the models almost useless.
Another aspect that can skew models is the effect of self-regulated behaviour change – the idea that people respond to news coverage, case numbers and holiday plans and change their behaviour without being told to by government ministers. But Sage modellers explicitly left this out of their models. Now that’s changed. The most recent Sage documents published this week concede that self-imposed behaviour change had a drastic effect. They present a study from the University of Bristol that found: ‘Less than half of respondents (40 per cent) reported [that behaviour changes] were due to Plan B implementation, as opposed to voluntary.’ Bristol estimated that this cut infections by a quarter.
What Sage say now
The 102nd meeting of Sage on 6 January considered some updated modelling from Warwick. The new predictions are obviously more accurate as modellers have accepted what was true in South Africa is now true in England and so they can fit real-world data to their models. The most relevant scenarios (the ones suggesting 50 per cent severity, with a generation time about a third shorter than Delta and no restrictions other than Plan B) suggest a peak around now of 5,000 hospitalisations a day. Yesterday there were 1,698 hospitalisations.
Last week there were calls for Sage modelling to be included in the pandemic public inquiry. This week those calls gathered pace. There was a heated, though poorly attended, debate in Westminster Hall secured by the Isle of Wight MP Bob Seely. Part of the discussion was on the narrow selection of modelling groups presented to government. As Sage modeller Dr Ellen Brooks Pollock said on Spectator TV on Thursday, there are around ten modelling groups contributing to SPI-M. Her own modelling group had estimated deaths below the current peak. Why then do published Sage papers only seem to draw on modelling from Warwick, LSHTM and Imperial?
Dr Brooks Pollock also revealed that the Sage secretariate translates ‘policy asks’ into epidemiological questions that modelling can answer. These questions are then sent to modellers and the work is commissioned. What these policy questions are, and how they are translated into modelling commissions is perhaps the next piece of the puzzle.