Gender pay gap activists have had an exciting few weeks, especially with the new statistics showing these gaps at the level of individual companies, at least those with more than 100 employees.
The stats were produced by the Workplace Gender Equity Agency (WGEA).
With so much activist exhilaration around, an important 30-year anniversary was overlooked – the publication of the ABS Average Weekly Earnings (AWE) statistics on February 22 of this year.
The latest publication includes data spanning from November 1994 to November 2023, revealing a three-decade-long picture of what Australians have been earning, including the evolution of different pay between men and women.
This publication has tirelessly churned out thousands of pay gap statistics over the decades and more than anything else, has fuelled the demands for gender quotas and affirmative action.
Like the WGEA’s survey, it has some significant flaws as an apples-to-apples comparison tool.
Pilots get paid more than flight attendants, and there are relatively more male pilots and relatively more female flight attendants. The AWE data doesn’t account for different jobs, at least, not in the free publicly available statistics that are published.
Even so, the AWE has some useful characteristics. Firstly, it presents average wage data across three dimensions.
It splits wage data by the geographic location of workers; the industry in which workers work; and whether the employer is in the private or public sector.
Another useful feature is that the data focuses on ‘full-time’ workers, which means the estimates are not distorted by the fact that more women choose part-time work.
Before I highlight some of the stats, a technical note is that I’m only describing ‘original’ data (not seasonally adjusted or trend), and I refer only to that of ‘ordinary time earnings’ (not total earnings).
In November 1994, the average weekly wage of full-time male workers was $669, compared to women with $561. This represents a pay gap of 19.3 per cent.
As of 2023, the average male worker is now earning $1,983 per week, compared to women with $1,745, revealing a difference of 13.6 per cent. So, on these ABS aggregate estimates, there has been a closing of the gap.
Back in 1994, the industry with the largest pay gap was that of finance and insurance, where men working full-time earned $800 per week, compared to $548 for females – a gap of 31.5 per cent.
Today, the gap for this industry has reduced to 17.5 per cent, and finance has now slipped to fourth place in terms of gap size.
It is in the finance industry where the pay gap appears to have declined most, at least in terms of ‘ordinary hours’ of work which excludes bonuses. Note that performance bonuses are an important part of remuneration in financial markets and finance.
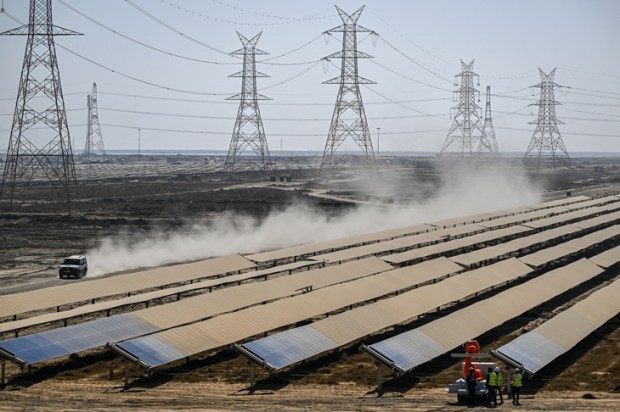
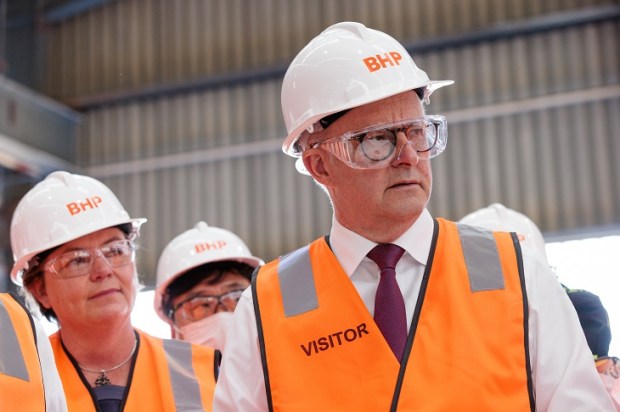
Mining is also an interesting case study, as it has always been and continues to be a male-dominated industry.
In 1994, mining had the second highest pay gap, that of 29.1 per cent, with men earning a full-time weekly wage of $958.
Today, the wage gap has almost halved to 15.8 per cent. Male miners currently get an average wage of $3,049 per week – the highest of any other industry and the only one to break the $3,000.
On a state and territory basis, we see that in 1994, the wage gap was highest in Western Australia (31.7 per cent), reflecting the male dominance of jobs in the high-paying mining industry.
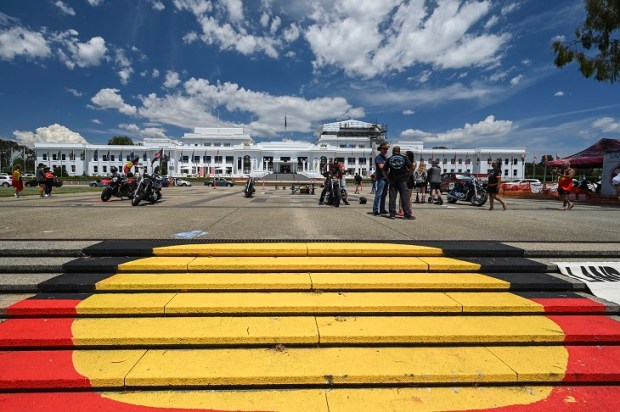
Interestingly, in that year, the ACT had the second-highest pay gap, 22.8 per cent.
We can see in the data that the ACT with its dense population of bureaucrats also had the highest male weekly wage ($771) in 1994, even more than NSW ($695) with its high-earning finance industry based in Sydney.
Thirty years later, WA has retained its leadership position in pay gaps, recording a 27.7 per cent as of November 2023. Tasmania currently has the lowest (5.7 per cent). WA also now has the highest weekly wage level of any state, with the ACT in second place.
Throughout the three decades, the private sector has maintained a higher pay gap than that found in the public sector.
In 1994, the gap was 13.5 per cent compared to the private sector of 24.1 per cent. The latest figures show the public sector wage gap is 10.3 per cent, compared to 14.7 per cent for private employees.
While the majority of statistical categories reveal sex pay gaps have declined, there are some in which it has increased.
Within the arts and recreation services industry, the pay gap has increased from 9.4 per cent in 1994 to 15.5 per cent today – interesting given the moral outrage of the artistic community towards the patriarchy.
Interestingly also, the healthcare and social assistance industry has also seen an increase, going from a 19.3 per cent gap in 1994 to 20.6 per cent today.
The Northern Territory has also experienced an increased gap, 16.1 per cent to 18.2 per cent over the three decades.
The ABS AWE publication has received a lot of attention over its lifespan. It has in effect been the data workhorse of the pay gap activists.
However, now with new WGEA’s wage gap data being published for specific companies that have woke boards and brands to protect, the WGEA statistics are likely now the go-to source for promoting affirmative action.
The AWE’s 30th birthday may be the start of its decline in relevance as a key player in the gender wars.
Nick Hossack is a public policy consultant. He is a former policy director at the Australian Bankers’ Association and former adviser to Prime Minister John Howard.