The Global Warming Policy Foundation has just published The state of the climate 2023 by Ole Humlum. It is a compilation of measurements and is not reliant upon numerical models. So, dear reader, I have consumed a couple of good reds doing the 70 pages of reading for you to save you the trouble and to stop you worrying about climate boiling.
It is a more comprehensive report than NOAA’s State of the Climate Report because NOAA’s politicised report ignores atmospheric temperature trends. It has been well established by Jennifer Marohasy and others that the land temperature measurements are doctored and therefore unreliable. Humlum uses the far more reliable University of Alabama in Huntsville and Remote Sensing Systems atmospheric trends derived from satellite temperature 3D measurements of the atmosphere. Compared to NOAA, Humlum’s report shows the vast number of natural variations and trends in troposphere temperature, ocean temperature, the Southern Oscillation Index, the Pacific Decadal Oscillation, the Atlantic Multidecadal Oscillation, sea level, sea ice, snow cover and storm and hurricane energy. These variations are normally ignored by climate ‘science’ catastrophists.
Here are a few take-aways:
a) The measured global average temperature change over the last 40 years is about 0.18 degrees Celsius per decade. This does not sound like a scary climate emergency to me. Humlum notes that a proportion of the temperature increase is reported to be due to ‘administrative changes’! Life can easily adapt to a change of 0.18 degrees C per decade.
b) Humlum warns against overstating short-term warming or cooling and notes that the past does not change but the temperature record is continually changed, that the record differs and is not of equal scientific quality.
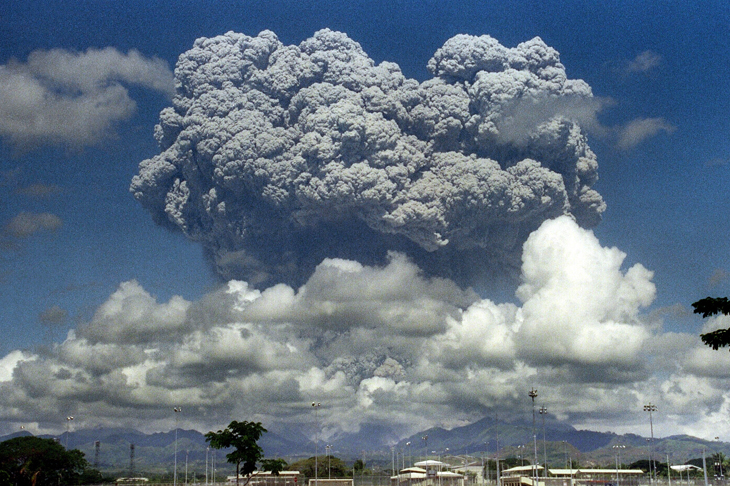
c) Global warming since 1980 has predominantly been a northern hemisphere phenomenon with step changes from 1994 to 1999, influenced by the Mount Pinatubo volcanic eruption of 1992-1993 producing cooling and the 1997 El Niño event producing warming, and the 2015-16 El Niño warming. Such step changes cannot be explained by a gradual increase in atmospheric CO2.
d) Warm years are when ocean heat is released to the atmosphere during El Niño events such as 2016 and 2023 whereas 2021 and 2022 were cooler due to the cold La Niña event in the Pacific Ocean. In 2023, the global average of air temperature was very high relative to an instrumental record since 1850. Since 1950, El Niño-La Niña events have been on 3.6-year and possibly 5.6-year cycles.
e) Since 1979, lower troposphere temperatures have increased, most clearly over the land, probably due to changes in cloud cover and land use.
f) Data for the Pacific Decadal Oscillation (PDO) extends back to 1854. It is in phase with global temperature changes and is tied to sea surface temperature in the planet’s largest ocean. When the PDO is negative (i.e. sea surface temperature is relatively cool), global air temperature decreases. This happened from 1945 to 1977. There was a positive PDO from 1977 to 1998 when sea surface temperature was relatively warm. The changes in the PDO are unrelated to atmospheric CO2.
g) The Atlantic multidecadal oscillation (AMO) is an index of North Atlantic sea surface temperature and correlates with air temperature and rainfall over much of the northern hemisphere. It is reflected in the frequency of severe Atlantic hurricanes. Two of the most severe droughts in the US (1930s, 1950s) occurred during a time of peak AMO values. The AMO is influenced by a 70-year-long cycle.
h) Tide gauge measurements of 1 to 2 mm per year do not indicate any acceleration or deceleration of sea level change. The tide gauges give an average sea level rise lower than the satellite sea level rise (3 to 4 mm per year). Humlum states that there is no explanation for this difference in data sets. There has been no accelerated sea level rise as atmospheric CO2 has risen.
i) Possible sea level changes must be considered in the light of land level rises and falls measured at 2 mm per year. This has a profound effect on coastal planning but is ignored by local authorities. According to the IPCC, modelled sea level at Oslo should rise by 17.5 cm by 2100 but the measurements since 1914 show that it has dropped by 27 cm.
j) Sea ice extent is stable or possibly even rising.
k) Both northern and southern hemisphere snow cover is more or less stable since the onset of satellite observations.
l) Global precipitation was high in 1956, 1973 and 2010 and low in 1941, 1965, 1987 and 1992. The global precipitation anomaly is influenced by 3.6- and 5.6-year cycles, similar to the cycles for the Southern and Pacific Decadal Oscillations.
m) Global tropical storm and hurricane energy is within the range measured since 1970. Oscillations of 6.5- and 11.5-years-duration were noted and, in the Atlantic Basin, natural rhythms of 61.5 years duration and possible 5.6 years were measured. In the US, hurricane landfalls are within the range of observation since 1851.
n) Tropospheric CO2 shows an annual increase on 1 part per million per year since infra-red measurements began in 1958. Humlum does not mention that these measurements are not in accord with the variability of earlier chemical measurements. The 12-month change of tropospheric CO2 has a periodic variation of 3.6-year duration not seen in smoothed data. There is no perceptible effect on atmospheric CO2 due to the Covid-related drop in CO2 emissions in 2020-21 showing that natural processes far outweigh human emissions. This suggests any future reductions in the use of fossil fuels are unlikely to have any effect of the amount of atmospheric CO2.
Concurrent with the release of Humlum’s report was the release of the Wyoming Climate Report by the CO2 Coalition. Wyoming is the largest coal-producing state in the US with over 40 per cent of US production in 2022. Wyoming is pushing to ‘carbon capture’ to achieve ‘net zero’ based on the erroneous assumption that increasing CO2 in the atmosphere will harm the environment and people in Wyoming. Surely the Cowboy State knows that an increased atmospheric CO2 and a slight warming is good for the environment and Wyoming’s citizens. Whatever the good burghers of Wyoming do, it will not change Chinese and Indian emissions. The Wyoming Climate Report showed that:
- Current CO2 levels are at or near historically low concentrations.
- Doctoring of historical temperature records have artificially amplified current warming. Temperature has increased by 0.7 degrees C since 1895, heatwaves peaked in the 1930s and have been in slight decline since then and night temperature has increased thereby lengthening the growing season.
- Rainfall, although variable year-to-year, has not been decreasing, droughts have not increased and severe weather and natural disasters are declining.
- Agricultural production and vegetation have increased.
An Appendix to the Wyoming report states that future temperature estimates are significantly over exaggerated because of the urban heat island effect, doctoring of the historical temperature record and fabricated data for stations that no longer exist or are no longer reporting.
You have a far greater chance of dying before your time from socialist stupidity than climate change.
Got something to add? Join the discussion and comment below.
You might disagree with half of it, but you’ll enjoy reading all of it. Try your first month for free, then just $2 a week for the remainder of your first year.