Two stories are emerging from the Covid Inquiry: one that it wants to tell and one that it does not. The first is a tale of foul-mouthed incompetence, of which there’s no shortage of evidence dredged from the private messages of the main actors. The more important story can be found in the submitted statements – hundreds of pages of thoughts, documents and reflections. They raise an important question which Baroness Hallett’s inquiry shows little interest in answering: was lockdown based on a false premise, conjured up by poorly drafted models?
This week the inquiry heard from Ben Warner, who in December 2019 was brought in by Dominic Cummings to be the head of data at No. 10. He quickly became one of the most important special advisers in the building, given that the liberty and future of the country during the pandemic was decided not by parliament or the cabinet but according to the production and interpretation of data by a small number of officials. In his written evidence Warner made an admission that went unnoticed by the inquiry (though not by academics such as Oliver Johnson). It may stand to be one of the most important points of the whole debacle.
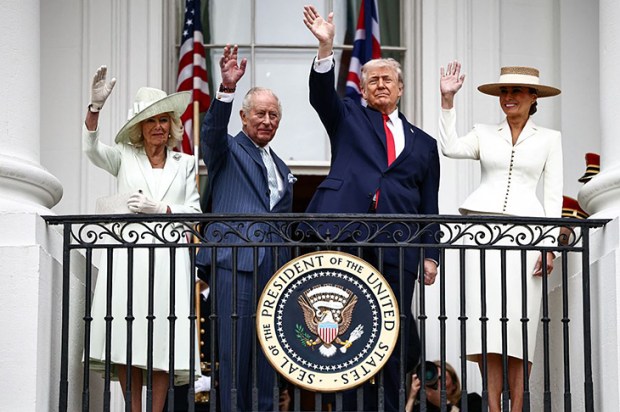
The key part of Warner’s statement sheds light upon Whitehall’s flawed decision-making. On 31 October 2020, some 14 million British TV viewers sat down to watch an emergency press conference in which the Boris Johnson, flanked by Sir Patrick Vallance and Chris Whitty, announced a second lockdown. Sir Patrick presented a slideshow giving the data that justified the restrictions.
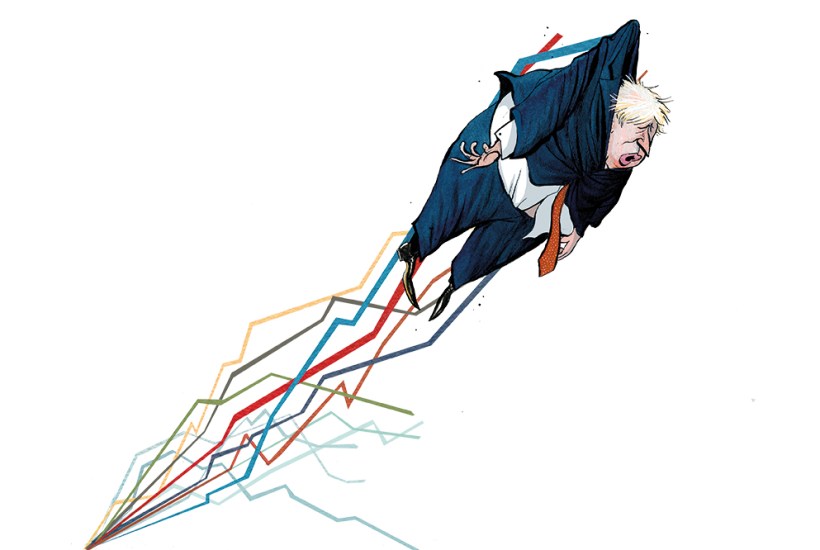
It was terrifying. The argument was summed up by a graph saying that if there were ‘no changes in policy or behaviour’, there could be up to 4,000 deaths a day, three times the number from the first wave in the spring. The other scenarios (later presented with oversimplified caveats by the BBC) were hardly more reassuring. It seemed to be an open-and-shut case for lockdown.
But the graph was wrong. It was out of date and based on flawed information, as was later pointed out by academics including Cambridge’s David Spiegelhalter and by the UK Statistics Authority itself. Might this have been a genuine mistake? In the rush and the panic – news of the lockdown had already leaked to the press – surely officials would have published a wrong graph only if they believed it to be right?
In his testimony, Warner remembers seeing a graph being circulated among scientists two days before lockdown that was ‘screen-shotted out of a SPI-M [the modelling group] working paper’. It ‘showed the predictions from different UK academic groups if the pandemic carried on with no further changes’. This precisely fits the description of the Halloween graph. Warner sent the screenshot to colleagues in No. 10 and the Cabinet Office.
Angela McLean, now Chief Scientific Adviser but then at the Ministry of Defence, sounded the alarm. The graph had been based on a rate of virus growth – the R number – that was by then known to be incorrect. ‘Angela flagged that, because of more recent data, R was now predicted to be lower and therefore the peak number of deaths would be lower than presented in the SPI-M graph.’ Warner and McLean agreed that a more sensible graph, the ‘reasonable worst-case scenario’, should be used instead.
Warner testified that he went into the cabinet room to raise the alarm to the Prime Minister and his officials. The Covid peak might be half of that forecast, he said. Having flagged corrupt data, he thought the graph would be taken out of circulation. He says he left No. 10 that day ‘under
the impression that the SPI-M working paper graph was not going to be used in any public announcement’.
Only later did Warner find out that this graph had been shown on national television. He was dismayed, not least because he knew it would look as if officials were incompetent. He was right: they were castigated. ‘Unfairly in my view,’ he wrote, ‘because these results should not have been presented when it was known in Government at this point that they were no longer up to date.’ He doesn’t claim the second lockdown was an error, but his evidence does question the quality of data upon which the policy was based.
If the second lockdown was justified to the public with data that was known to be wrong by the government before it was televised, then surely the government acted unethically. Public-health best practice stresses the need for transparency and honesty, including being frank about error margins in models. Honesty should have been paramount.
Given the consequences of lockdown – social, economic, educational – Warner’s discovery ought to be a scandal. There should be a flurry of follow-ups to discover how Whitty and Sir Patrick end up on national TV presenting information that was not just bogus, but known to be bogus.
The revelation raises other issues. How much government policy is based on models? How transparent are they? Are the assumptions published? The Covid Inquiry might have uncovered the biggest question in politics: how did broken models make their way through Whitehall without proper scrutiny? But we should not expect the Hallett Inquiry to pursue this argument.
Got something to add? Join the discussion and comment below.
You might disagree with half of it, but you’ll enjoy reading all of it. Try your first month for free, then just $2 a week for the remainder of your first year.