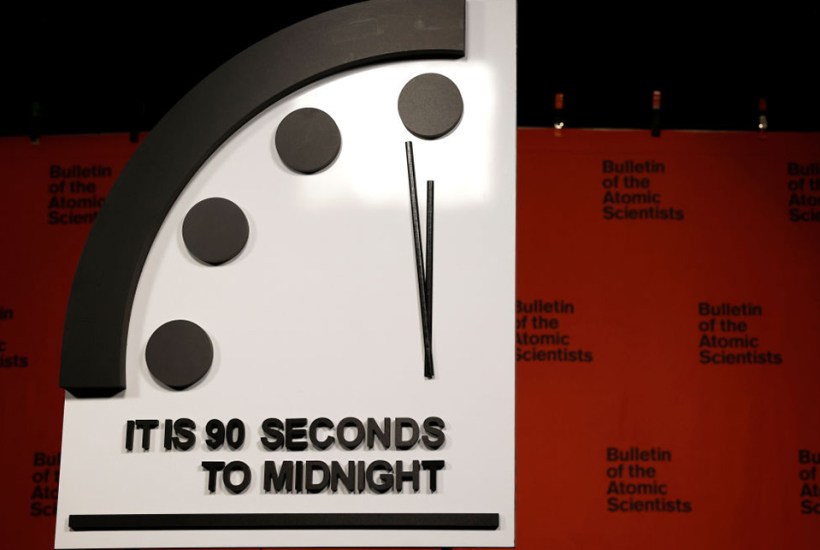
The final countdown
The Bulletin of Atomic Scientists moved its ‘Doomsday Clock’ from 100 seconds to midnight to 90 seconds to midnight – the closest it has ever been to our apparent annihilation. How close was it during other periods of history?
Cuban missile crisis, 1962 The standoff between the US and the Soviet Union brought the world to the brink, yet it was apparently a time of optimism compared with today – a few months later the clock was moved back from 7 to 12 minutes.
Chernobyl, 1986 The world’s worst nuclear accident didn’t register on the clock: the hands were not moved for two more years, and then back from 3 minutes to 6 minutes.
End of Cold War, 1991 The clock was moved backwards from 10 to 17 minutes to midnight, the furthest it has been in 76 years.
The global crisis of 1998 The year 1998 saw a financial crisis, but a geopolitical one? Maybe it was just boredom which made the scientists shift their clock from 14 minutes to 9 minutes to midnight, the biggest shift ever towards doom. The scientists said they were doing it because India and Pakistan had tested nuclear weapons.
9/11, 2001 Clock went from 9 to 7 minutes to midnight in early 2002.
Donald Trump’s election, 2016 Scientists didn’t seem to like Trump, shifting the clock from 3 minutes to 2 minutes in the first two years of his presidency.
Late return
How many of Britain’s 11.3% self-assessment taxpayers paid penalties in 2019/20? The first figure is for the £100 penalty for late filing. The second is for the fine for being 30 days late with payment.
1st income decile 4.6% 0.1%
2nd decile 2.7% 0.1%
3rd decile 2.1% 0.1%
4th decile 1.7% 2.6%
5th decile 1.6% 3.3%
6th decile 1.4% 3.8%
7th decile 1.3% 4.0%
8th decile 1.3% 4.3%
9th decile 1.6% 4.7%
10th decile 2.1% 3.6%
Source: taxpolicy.org.uk
Flu past
How many people had a flu jab this winter? Percentage of eligible people who had it:
Over-65s 78.4
50-65-year-olds in clinical risk group 60.3
50-65-year-olds not in
a clinical risk group 38.8
Pregnant women 33.2
Two-year-olds 39.8
Among the over-65s, take-up was highest in Derbyshire (83%) and lowest in north central London (65.1%)
Got something to add? Join the discussion and comment below.
You might disagree with half of it, but you’ll enjoy reading all of it. Try your first month for free, then just $2 a week for the remainder of your first year.