
Many in the media, politics, and the health industry have expressed the view that Australia has fared well since the beginning of the Covid pandemic – but how true is the narrative?
There has been an emphasis on the benefit of achieving low Covid fatality figures, but what if the benefit of meeting the ‘dying with Covid’ metric is outweighed by the cost? A cost that includes excess mortality, debt, long-term health concerns, and many other variables that need to be taken into consideration.
The purpose of this article is to examine excess mortality across different regions to better understand what worked and what didn’t.
Given the stringency and enormous burden of government and Health Department strategies, anything other than a significant comparative benefit in excess mortality should be considered a failure. For a comprehensive cost-benefit analysis (CBA) across multiple variables, consider reading the following book by Gigi Foster and Sanjeev Sabhlok.
According to the statistical office of the European Union, Eurostat, and for the purpose of measuring the impact of the pandemic:
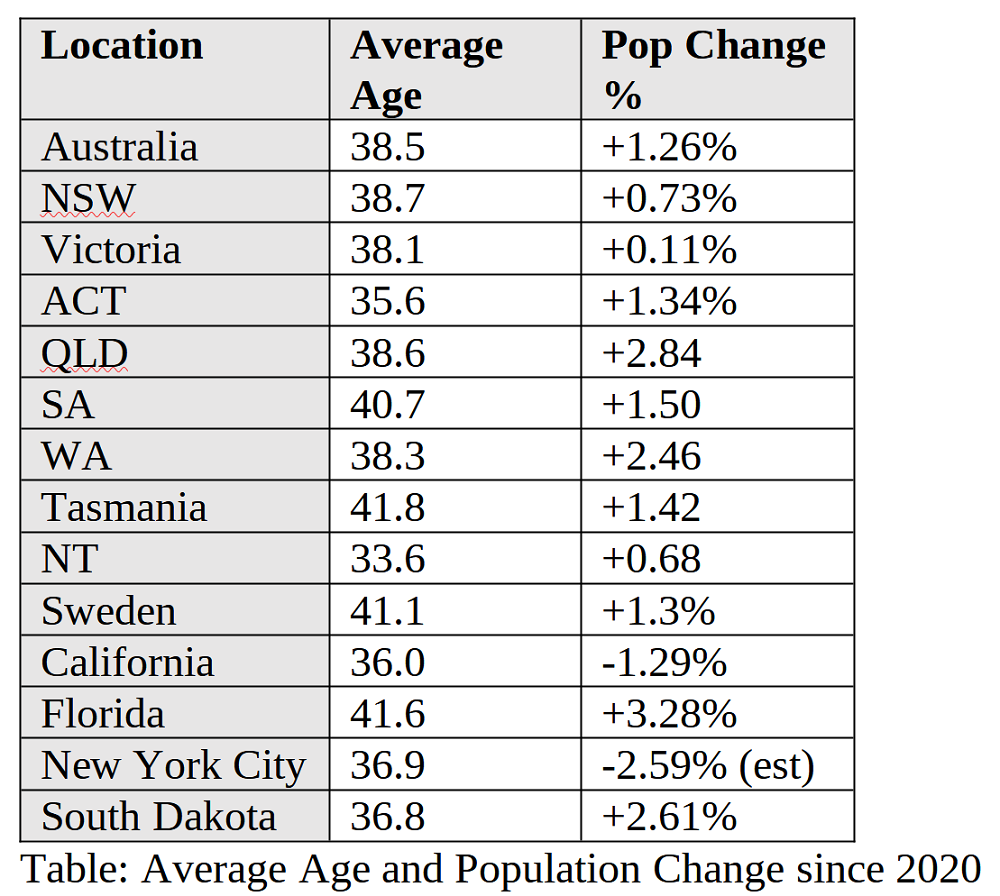 Comparison within Australia and Sweden from 2020-22
The following table is the excess pandemic mortality using the same baseline methodology. I have included the ABS figures for transparency purposes, although it is noticeable that even using a modified baseline the excess mortality of Sweden is substantially less than Australia.
Comparison within Australia and Sweden from 2020-22
The following table is the excess pandemic mortality using the same baseline methodology. I have included the ABS figures for transparency purposes, although it is noticeable that even using a modified baseline the excess mortality of Sweden is substantially less than Australia.
 Comparing the two largest states of NSW and Victoria reveals that Victoria has a significantly higher mortality rate over the duration of the pandemic – even though Victoria has a marginally lower average age and lower population growth. As stringent as the NSW restrictions were, Victoria was even more severe with some of the harshest measures in the world. Adding Sweden, which had no stringent mandates, along with a higher average age and population growth, reveals a trend – especially considering Sweden encountered the most virulent form of Covid without the advantage of time and experience in treating the disease. This data is a strong indicator that the more severe the health measures, the worse the overall health outcomes.
The poor ACT excess mortality results are surprising. It had comparable policies to NSW but with a significantly younger population and it has the longest life expectancy and lowest obesity levels in the country. It had a slightly higher population growth, but not enough to account for the substantial excess mortality. Being a smaller region there may be some variability in the data but nevertheless further investigation as to the cause of this is warranted.
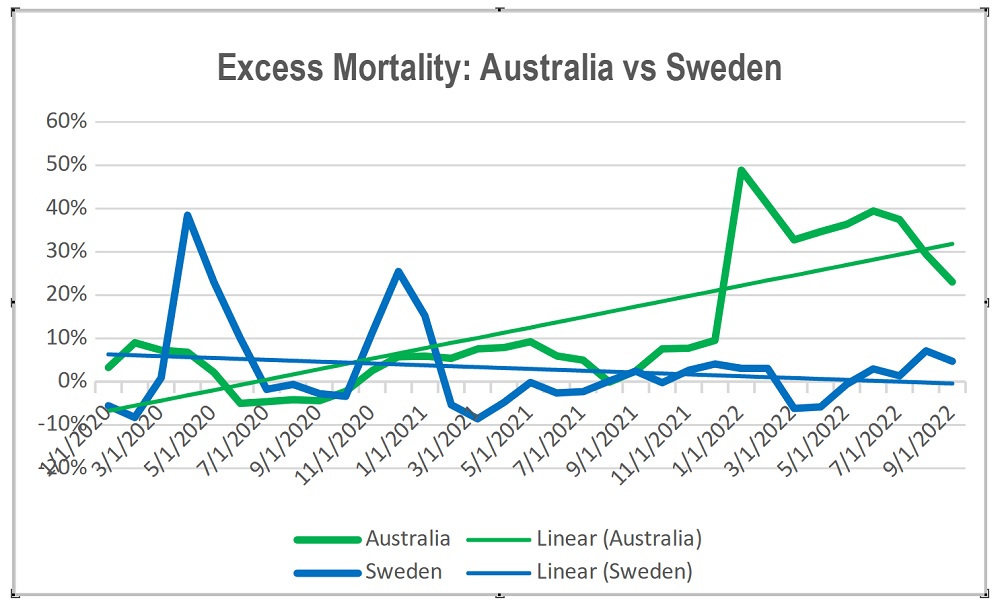
From the following graph we can see Sweden encountered excess mortality in 2020 but has been on a normalising trend since. Compare this to Australia which was already experiencing excess mortality prior to coming out of lockdown in 2021. It has also produced higher excess mortality rates than Sweden did in 2020. Also of concern is the high rate of excess mortalities continuing in 2022 and, if current trends are maintained, for some time into the future.
Comparing the two largest states of NSW and Victoria reveals that Victoria has a significantly higher mortality rate over the duration of the pandemic – even though Victoria has a marginally lower average age and lower population growth. As stringent as the NSW restrictions were, Victoria was even more severe with some of the harshest measures in the world. Adding Sweden, which had no stringent mandates, along with a higher average age and population growth, reveals a trend – especially considering Sweden encountered the most virulent form of Covid without the advantage of time and experience in treating the disease. This data is a strong indicator that the more severe the health measures, the worse the overall health outcomes.
The poor ACT excess mortality results are surprising. It had comparable policies to NSW but with a significantly younger population and it has the longest life expectancy and lowest obesity levels in the country. It had a slightly higher population growth, but not enough to account for the substantial excess mortality. Being a smaller region there may be some variability in the data but nevertheless further investigation as to the cause of this is warranted.
From the following graph we can see Sweden encountered excess mortality in 2020 but has been on a normalising trend since. Compare this to Australia which was already experiencing excess mortality prior to coming out of lockdown in 2021. It has also produced higher excess mortality rates than Sweden did in 2020. Also of concern is the high rate of excess mortalities continuing in 2022 and, if current trends are maintained, for some time into the future.
 Comparison within Australia and Sweden in 2022
The following table is the excess pandemic mortality using the same baseline methodology. I have included the ABS figures for transparency purposes, although it is noticeable that even using a modified baseline the excess mortality of Sweden is substantially less than Australia.
Comparison within Australia and Sweden in 2022
The following table is the excess pandemic mortality using the same baseline methodology. I have included the ABS figures for transparency purposes, although it is noticeable that even using a modified baseline the excess mortality of Sweden is substantially less than Australia.
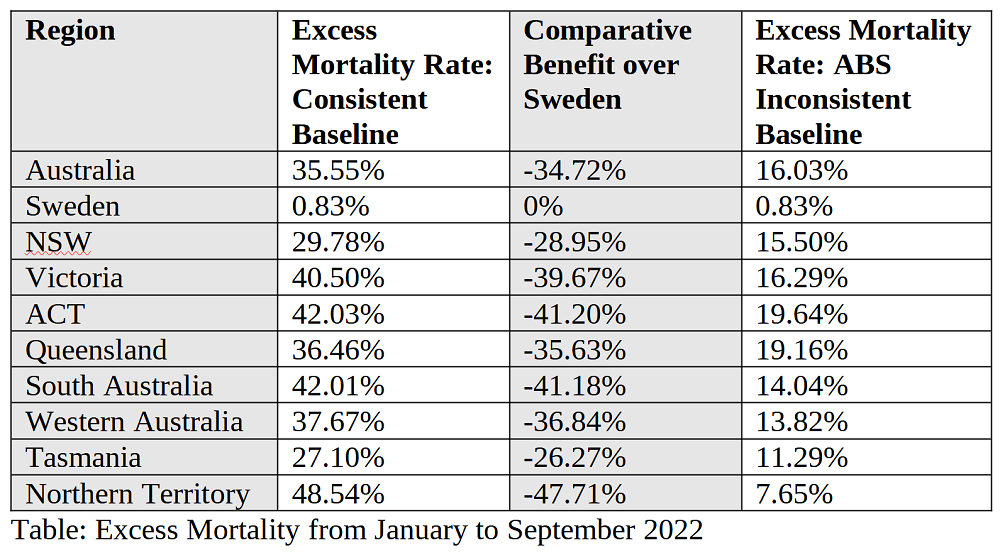 The 2022 excess mortality figures are beginning to be a topic for discussion in the media as Australians realise the cost of the health policies implemented. The comparison with Sweden is stark. Once population increase is factored in, it may well be that in 2022 Sweden will have a lower mortality rate than prior to the pandemic. In comparison, Australia is experiencing very high mortality rates which may indicate that it will take some time to return to normal.
USA Comparison
The following table uses raw data from the CDC. This was to keep the baseline as comparable as possible. Even so, the calculations are a little different from the method used for Australia and the variation could be up to a 2 per cent, according to the CDC. It is the same method used within the country, and hence useful for state health response comparisons.
The 2022 excess mortality figures are beginning to be a topic for discussion in the media as Australians realise the cost of the health policies implemented. The comparison with Sweden is stark. Once population increase is factored in, it may well be that in 2022 Sweden will have a lower mortality rate than prior to the pandemic. In comparison, Australia is experiencing very high mortality rates which may indicate that it will take some time to return to normal.
USA Comparison
The following table uses raw data from the CDC. This was to keep the baseline as comparable as possible. Even so, the calculations are a little different from the method used for Australia and the variation could be up to a 2 per cent, according to the CDC. It is the same method used within the country, and hence useful for state health response comparisons.
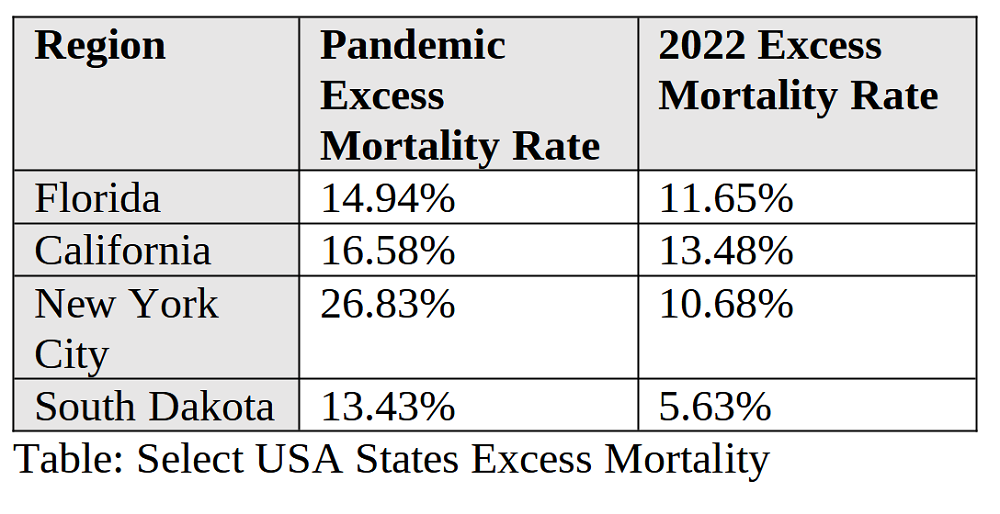
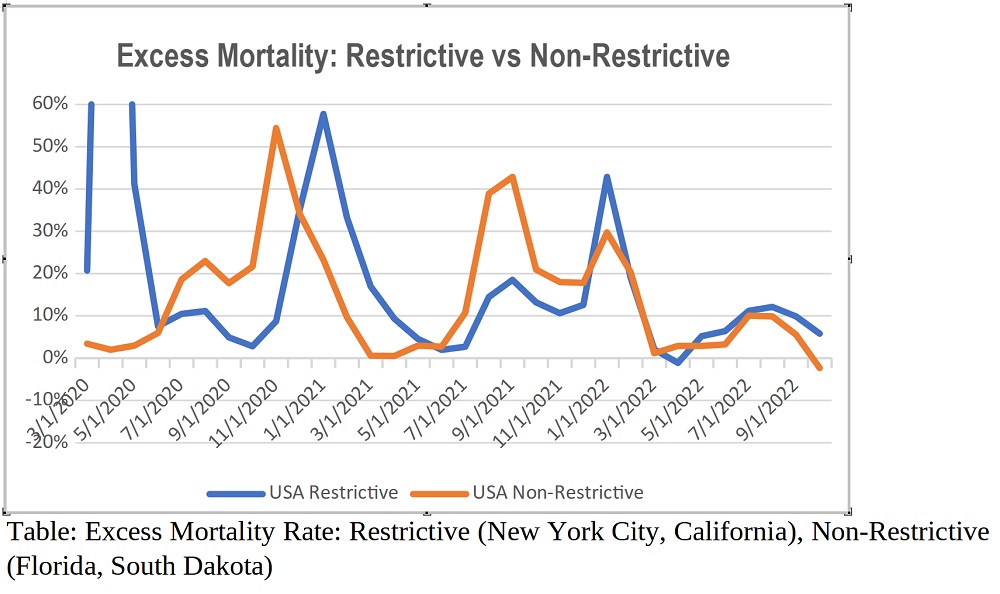 California and New York City were praised for some of the most restrictive measures in America, whilst Florida and South Dakota were criticised for their minimal intervention. Given this, we should see a significantly lower excess mortality from the intervention states. This, however, is not the case. When significant increases in population for Florida and South Dakota are factored in it becomes difficult to conclude any benefit from invasive health policies and strongly indicates a worse overall health outcome for the population.
How many lives have been saved by our Health Officials?
Dr Jay Bhattacharya expressed the opinion during a discussion in Sydney in September 2022 that Australia’s swift closure of international borders, in conjunction with low community transmission of the virus at the time, delayed the onset of Covid. The CBA by Gigi Foster and Sanjeev Sabhlok estimates that ‘at most 9,951 Covid deaths were avoided by lockdown policies’. However, it also concludes ‘the costs of Australia’s Covid lockdowns have been at least 68 times greater than the benefits they delivered’.
If many of the experts were right in their criticisms of Sweden’s approach, we should expect to see a lower number of comparative fatalities. So, let’s see what happens when we evaluate the Australian response with the hypothetically adjusted Swedish figures.
California and New York City were praised for some of the most restrictive measures in America, whilst Florida and South Dakota were criticised for their minimal intervention. Given this, we should see a significantly lower excess mortality from the intervention states. This, however, is not the case. When significant increases in population for Florida and South Dakota are factored in it becomes difficult to conclude any benefit from invasive health policies and strongly indicates a worse overall health outcome for the population.
How many lives have been saved by our Health Officials?
Dr Jay Bhattacharya expressed the opinion during a discussion in Sydney in September 2022 that Australia’s swift closure of international borders, in conjunction with low community transmission of the virus at the time, delayed the onset of Covid. The CBA by Gigi Foster and Sanjeev Sabhlok estimates that ‘at most 9,951 Covid deaths were avoided by lockdown policies’. However, it also concludes ‘the costs of Australia’s Covid lockdowns have been at least 68 times greater than the benefits they delivered’.
If many of the experts were right in their criticisms of Sweden’s approach, we should expect to see a lower number of comparative fatalities. So, let’s see what happens when we evaluate the Australian response with the hypothetically adjusted Swedish figures.
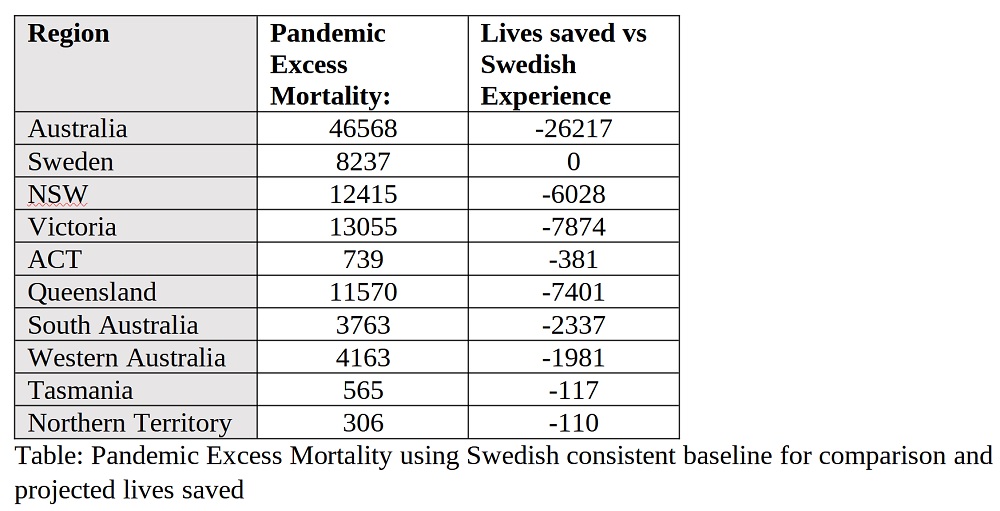 In this scenario, every state gains from adopting Sweden’s policies with Victoria benefitting from the most lives saved. NSW Health Minister Brad Hazzard claimed in December 2021 to have implemented policies that saved 25,000 lives and it turns out there is some truth to the statement. If Australia adopted Sweden’s policies, it may have saved over 25,000 lives (26,217). Even using the non-comparable ABS baseline, the figure comes in at 8,264.
How well have we been served by our Health Leadership?
Given the enormity of the costs of health strategies over the past three years, the data revealed fails to justify even a moderate benefit in excess mortality, in comparison to less restrictive regions which were considered poor performers. Whilst not directly comparable to Australia, this point is emphasised with the select data from the USA. Restrictive health policies simply do not work and result in significant negative outcomes to the population. Why we chose the path we did and what we can learn should be the subject of an external review. This review should be conducted by someone from a region which provided a freer, more considered, cost/benefit approach to health and its impact on society. Anders Tegnell, Joseph Ladapo – we can offer you a tour of the Harbour city, endless beaches, the Great Barrier reef, Uluru, the Apple Isle, Barossa Valley, Horizontal Falls, and the Boxing Day Cricket Test, what could be more enticing?
Follow Jason Strecker on Twitter: @JasonStrecker
In this scenario, every state gains from adopting Sweden’s policies with Victoria benefitting from the most lives saved. NSW Health Minister Brad Hazzard claimed in December 2021 to have implemented policies that saved 25,000 lives and it turns out there is some truth to the statement. If Australia adopted Sweden’s policies, it may have saved over 25,000 lives (26,217). Even using the non-comparable ABS baseline, the figure comes in at 8,264.
How well have we been served by our Health Leadership?
Given the enormity of the costs of health strategies over the past three years, the data revealed fails to justify even a moderate benefit in excess mortality, in comparison to less restrictive regions which were considered poor performers. Whilst not directly comparable to Australia, this point is emphasised with the select data from the USA. Restrictive health policies simply do not work and result in significant negative outcomes to the population. Why we chose the path we did and what we can learn should be the subject of an external review. This review should be conducted by someone from a region which provided a freer, more considered, cost/benefit approach to health and its impact on society. Anders Tegnell, Joseph Ladapo – we can offer you a tour of the Harbour city, endless beaches, the Great Barrier reef, Uluru, the Apple Isle, Barossa Valley, Horizontal Falls, and the Boxing Day Cricket Test, what could be more enticing?
Follow Jason Strecker on Twitter: @JasonStrecker
‘Excess mortality refers to the number of deaths from all causes measured during a crisis, above what could be observed under “normal” conditions. The excess mortality indicator simply takes the number of people who died from any cause, in a given period and compares it with a historical baseline from previous years in a period which was not affected by the pandemic … The higher the value, the higher the amount of additional deaths compared with the baseline. In the case of a negative indicator, this means that fewer deaths occurred in a particular month compared with the baseline period … Excess mortality is a more comprehensive measure of the total impact of the pandemic on deaths than the confirmed Covid-19 death count alone.’Countries chosen externally to Australia Sweden: This country was widely criticised for refusing to mandate health measures, as exemplified by Time magazine reporting on October 2020 with the headline, The Swedish Covid-19 Response Is a Disaster. It Shouldn’t Be a Model for the Rest of the World. It wasn’t alone, The Conversation article written by the Gratten institute, Director Health Program Stephen Duckett concluded that, ‘Sweden shouldn’t be seen as a model for Australia when it comes to Covid-19.’ On December 16, 2020, Professor Brendon Crabb of the Burnett Institute, which ‘helped inform public health policy by the Victorian, NSW and Australian governments’, reported: ‘I think it was as plain as the nose on your face that they were dicing with death quite literally … how anyone could think that was a sensible strategy and now look where they are.’ Given this, excess mortality not substantially superior to Sweden’s could be considered a failure on behalf of our Health leaders. America: California and New York City were praised for some of the most restrictive health policies in the country. Florida was widely criticised for removing restrictions in 2020 and South Dakota had no restrictions. I have compared ‘restrictive’ versus ‘non-restrictive’ regions. Restrictive regions could be considered as having failed in their policies if there is not a significant benefit in excess mortality to offset the societal and financial hardships incurred. Accuracy of the data and baseline The source and the usage of a consistent baseline across jurisdictions is important for accurate comparisons. The information used in this analysis has come from the raw sources at the relevant department. Most data of this type published tend to be from aggregated third-party sites which can contain extra algorithmic manipulation unique to the region. For transparency purposes I have included the following notes about the various countries’ practices:
- The Australian data came from the ABS. I have adjusted the baseline to use data from 2015-19 to aid in the consistency of comparison between jurisdictions. According to the ABS, ‘Data for 2021 is compared to an average number of deaths recorded over the 5 years from 2015-19 as was the case in previous publications. Data for 2022 is compared to a baseline comprising the years 2017-19 and 2021. 2020 is not included in the baseline for 2022 data because it included periods where numbers of deaths were significantly lower than expected.’ 2020 did not have a low excess mortality, but 2015 and 2016 did. These years were offset by 2017 and 2019 having higher than normal excess mortality. Removing 2015 and 2016 increases the baseline out of step with the baseline methodology consistently applied by the ABS. For pre-pandemic comparison, the ABS had been using a fixed baseline, presumably to help evaluate the impact of Covid. The statistical office of the European Union also uses this approach. Changing the baseline methodology specifically for 2022 creates misleading comparative results and complicates evaluation with other jurisdictions. This makes it more difficult to evaluate the true impact of the pandemic and which countries’ health policies worked, and which didn’t.
- The Swedish data comes from Statistics Sweden, who ‘is responsible for official statistics and for other government statistics’. The baseline data used is 2015-19 (the 5 years leading up to the pandemic).
- The American Data comes from the CDC database and has a few idiosyncrasies. The main challenge is the method the CDC has used to calculate the excess mortality. Unlike the 5 years from 2015-19 used for Sweden and adjusted for with Australia, the CDC baseline uses a 4-year moving average and excludes pandemic dates. The data removed can affect the accuracy of produced figures and in November 2021 the CDC changed the methodology to 6 years. This adjustment approximates a 4-year baseline from 2016-19. The CDC estimates a 2 per cent variation to the excess mortality figures. Another unusual feature was that negative excess values are set to zero. This rendered the supplied data unusable to analyse for trends. To overcome this, I calculated the excess using a formula. Given these extra variables direct comparisons using the American figures to countries using a different baseline methodology needs to be done carefully, however, states within America can be compared accurately.
Comparison within Australia and Sweden from 2020-22
The following table is the excess pandemic mortality using the same baseline methodology. I have included the ABS figures for transparency purposes, although it is noticeable that even using a modified baseline the excess mortality of Sweden is substantially less than Australia.
Comparing the two largest states of NSW and Victoria reveals that Victoria has a significantly higher mortality rate over the duration of the pandemic – even though Victoria has a marginally lower average age and lower population growth. As stringent as the NSW restrictions were, Victoria was even more severe with some of the harshest measures in the world. Adding Sweden, which had no stringent mandates, along with a higher average age and population growth, reveals a trend – especially considering Sweden encountered the most virulent form of Covid without the advantage of time and experience in treating the disease. This data is a strong indicator that the more severe the health measures, the worse the overall health outcomes.
The poor ACT excess mortality results are surprising. It had comparable policies to NSW but with a significantly younger population and it has the longest life expectancy and lowest obesity levels in the country. It had a slightly higher population growth, but not enough to account for the substantial excess mortality. Being a smaller region there may be some variability in the data but nevertheless further investigation as to the cause of this is warranted.
From the following graph we can see Sweden encountered excess mortality in 2020 but has been on a normalising trend since. Compare this to Australia which was already experiencing excess mortality prior to coming out of lockdown in 2021. It has also produced higher excess mortality rates than Sweden did in 2020. Also of concern is the high rate of excess mortalities continuing in 2022 and, if current trends are maintained, for some time into the future.
Comparison within Australia and Sweden in 2022
The following table is the excess pandemic mortality using the same baseline methodology. I have included the ABS figures for transparency purposes, although it is noticeable that even using a modified baseline the excess mortality of Sweden is substantially less than Australia.
The 2022 excess mortality figures are beginning to be a topic for discussion in the media as Australians realise the cost of the health policies implemented. The comparison with Sweden is stark. Once population increase is factored in, it may well be that in 2022 Sweden will have a lower mortality rate than prior to the pandemic. In comparison, Australia is experiencing very high mortality rates which may indicate that it will take some time to return to normal.
USA Comparison
The following table uses raw data from the CDC. This was to keep the baseline as comparable as possible. Even so, the calculations are a little different from the method used for Australia and the variation could be up to a 2 per cent, according to the CDC. It is the same method used within the country, and hence useful for state health response comparisons.
California and New York City were praised for some of the most restrictive measures in America, whilst Florida and South Dakota were criticised for their minimal intervention. Given this, we should see a significantly lower excess mortality from the intervention states. This, however, is not the case. When significant increases in population for Florida and South Dakota are factored in it becomes difficult to conclude any benefit from invasive health policies and strongly indicates a worse overall health outcome for the population.
How many lives have been saved by our Health Officials?
Dr Jay Bhattacharya expressed the opinion during a discussion in Sydney in September 2022 that Australia’s swift closure of international borders, in conjunction with low community transmission of the virus at the time, delayed the onset of Covid. The CBA by Gigi Foster and Sanjeev Sabhlok estimates that ‘at most 9,951 Covid deaths were avoided by lockdown policies’. However, it also concludes ‘the costs of Australia’s Covid lockdowns have been at least 68 times greater than the benefits they delivered’.
If many of the experts were right in their criticisms of Sweden’s approach, we should expect to see a lower number of comparative fatalities. So, let’s see what happens when we evaluate the Australian response with the hypothetically adjusted Swedish figures.
In this scenario, every state gains from adopting Sweden’s policies with Victoria benefitting from the most lives saved. NSW Health Minister Brad Hazzard claimed in December 2021 to have implemented policies that saved 25,000 lives and it turns out there is some truth to the statement. If Australia adopted Sweden’s policies, it may have saved over 25,000 lives (26,217). Even using the non-comparable ABS baseline, the figure comes in at 8,264.
How well have we been served by our Health Leadership?
Given the enormity of the costs of health strategies over the past three years, the data revealed fails to justify even a moderate benefit in excess mortality, in comparison to less restrictive regions which were considered poor performers. Whilst not directly comparable to Australia, this point is emphasised with the select data from the USA. Restrictive health policies simply do not work and result in significant negative outcomes to the population. Why we chose the path we did and what we can learn should be the subject of an external review. This review should be conducted by someone from a region which provided a freer, more considered, cost/benefit approach to health and its impact on society. Anders Tegnell, Joseph Ladapo – we can offer you a tour of the Harbour city, endless beaches, the Great Barrier reef, Uluru, the Apple Isle, Barossa Valley, Horizontal Falls, and the Boxing Day Cricket Test, what could be more enticing?
Follow Jason Strecker on Twitter: @JasonStrecker