The different rates of change in world income levels have provided Australia with a magnificent base on which to build our own prosperity. But, though our standard of living is testament to some success, political measures have blunted the potential level of achievement. A less regulated business regime and lower taxes especially on savings are vital to enhancing our income levels. Yet the ALP and to a lesser degree the Coalition are putting taxes on savings and have no stomach for deregulation.
Accelerating rates of change in world prosperity levels
This animated twitter graphic presents a fascinating review of the rise and fall of nations in the GDP stakes. Over the past half century, the constancy of the US, rise of Japan and Germany and the more recent rise of China and India are the dominant features. As late as 1969, Australia even crept into the top 10.
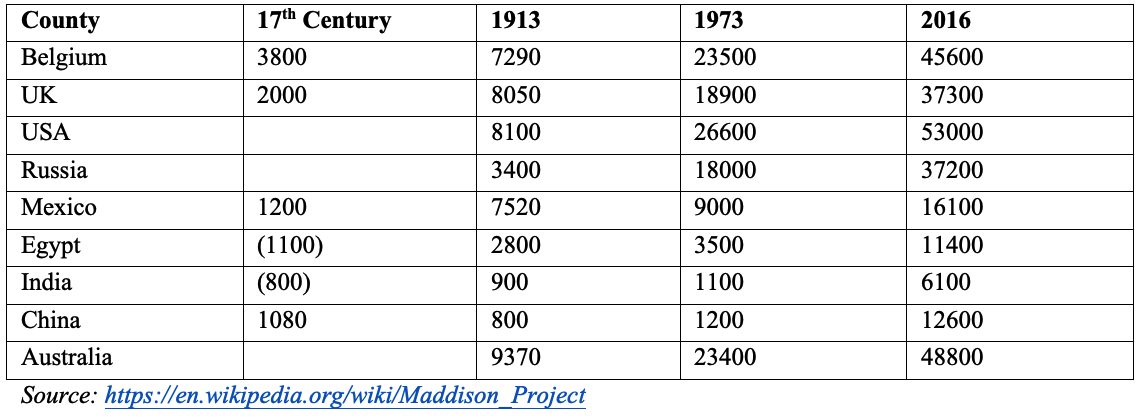
Reviewing a lengthier period, by the seventeenth century, Europe had pulled markedly ahead of the rest of the world in terms of GDP per capita. In 2011 International dollars the highest standard of living recorded according to Maddison was Belgium at $3,400-4,800 with some other European countries also relatively high but Eastern Europe, Asia and Latin America were all less than half of those common in western Europe. China in fact had an estimated per capita income of $1,083 in 1661, a level that fell and was not again reached until the 1970s.
By 1913, the western world’s living standards were 2-10 fold those of the rest of the world. Fast-forward to 1973 and this picture had not markedly changed. At that time, China and India had per capita GDPs at little more than $1,000 compared with $20,000 for the western world (by then including Japan).
By 2016, the western nations (now joined by the “Asian tigers”, S. Korea, Taiwan, Hong Kong and Singapore) had per capita incomes in the $30,000-53,000 range. Some of the former Soviet satellites were also approaching that level, which was double that seen in Latin America. Income levels of China ($12,500) and India ($6,100) were on rapid growth trajectories.
Below are some estimates drawing from Maddison, all of which are actually little more than educated best guesses (and difficulties in assessing Communist regimes’ income levels mean the 1973 estimates for Russia is clearly overstated).
 Income levels prevailing even among the most affluent nations 300 years ago would today be considered sufficient to provide only a barely imaginable level of poverty. But the statistics illustrate how rapidly nations have been able to catch up with living standards that not so long ago were seven or eightfold their own. Chinese and Indian income levels barely increased over the thousand years until the last three decades of the twentieth century but between 1973 and today those countries have experience growths in living standards of sixfold (India) and twelvefold (China).
Many countries, like Haiti and a range of what President Trump calls “questionably run” African countries, continue to have real income levels that are only 4-5 per cent of those of the US. Such countries are presently incapable of internally generating economic growth. Understandably, they place a priority on extracting funding from wealthier countries and, to this end, take very large delegations to conferences where such prospects are on the table – four out of the five largest delegations at the 2018 Climate Change Conference of Parties (COP 24) in Katowice were African, with Guinea-Bissau the largest at 408 (Australia made do with 30).
But the accelerating increase in Asian living standards is the dominant force for change. It provides a blueprint, on a grander scale than the success of the low tax, small government Pinochet regime in Chile (1973-1990) had in bringing about an emulation effect on other Latin American countries.
Evidence of the astonishing rise of China, and to a lesser degree India, is everywhere:
- At 831 million tonnes, China now produces half the world’s steel, having grown 60 fold since 1967; India produces 100 million tonnes, a 20 fold increase over the same period; by reference US produces about 82 million tonnes. In recent millennia, steel production has been regarded as the bellwether of industrial output.
- From a standing start, China now produces about a third of the world’s motor vehicles at 30 million a year; India produces a little under 5 million but has expanded production 60 fold since 1970; US produces around 11 million vehicles a year
- China (with Hong Kong) has close to half the world computer exports, while India after the US is the second largest software exporter.
- Chinese living in what the World Bank defines as “extreme poverty” fell from over 750 million in 1990 to 10 million in 2015
- In 2018 China built more skyscrapers than any other country and more in one year than has ever been built
Though, as this story illustrates, China may well be heading towards regulatory and high tax growth inhibition, its growth rate is still double that of Australia and the (much improved) US level.
Government and economic growth
The size of the government share in GDP is an important feature of economies. In ancient times the Roman government is estimated to have comprised around five per cent of GDP (most of which was spent on defence). And a crucial role was played in greater security of ownership afforded by the various courts that determined property disputes, albeit in an era where Emperors had considerable discretion both to extort and to murder complainants.
Low levels of government spending has characterised every rapidly growing nation in the modern industrial world. In England, Government spending was around 10 per cent of GDP from 1689 until the twentieth century (punctuated by a rise to 20 per cent during the Napoleonic wars).
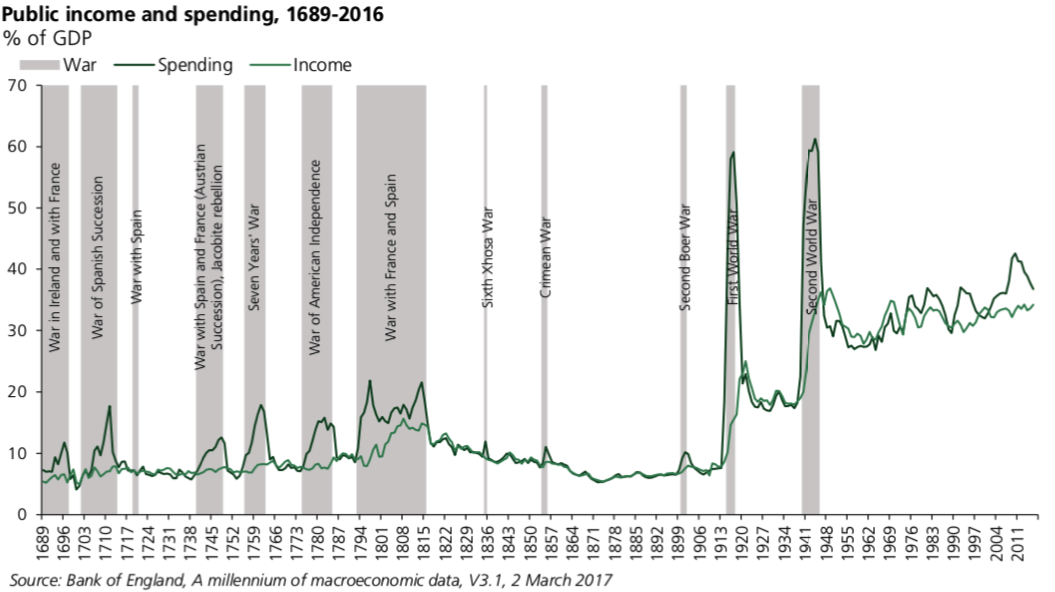 During that same period there was a massive clean out of regulations that had been accumulating in the centuries before the end of the sixteenth Century.
Japan followed a similar pattern following its early economic take-off after the Meiji restoration in 1868; except during the 1905 war with Russia, the share of government in GDP was around 12 per cent.
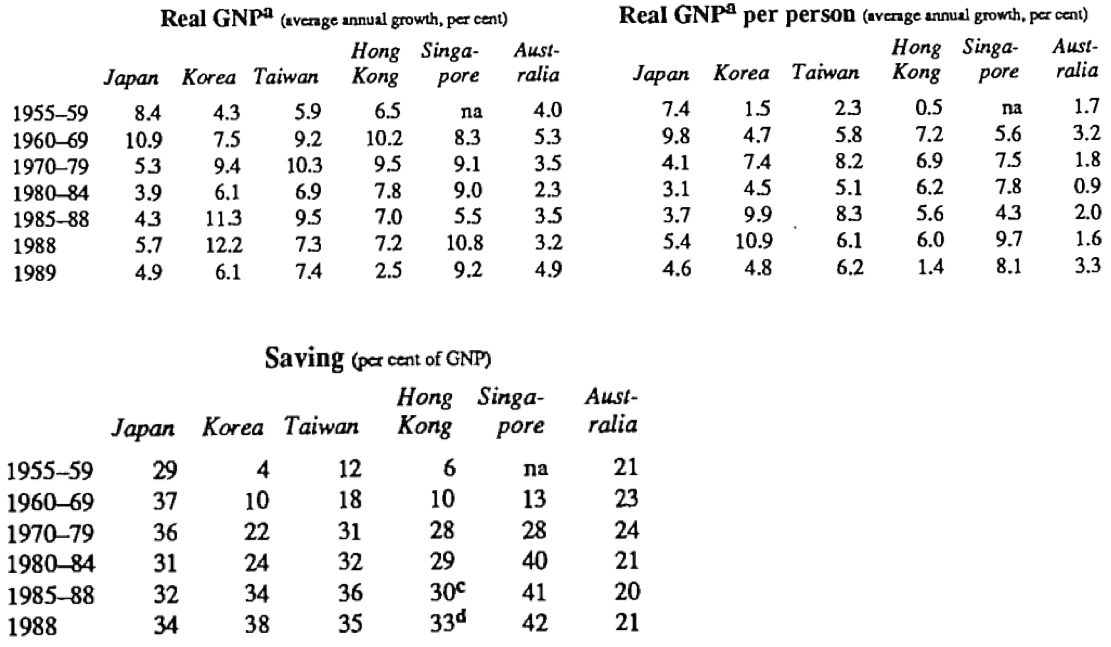
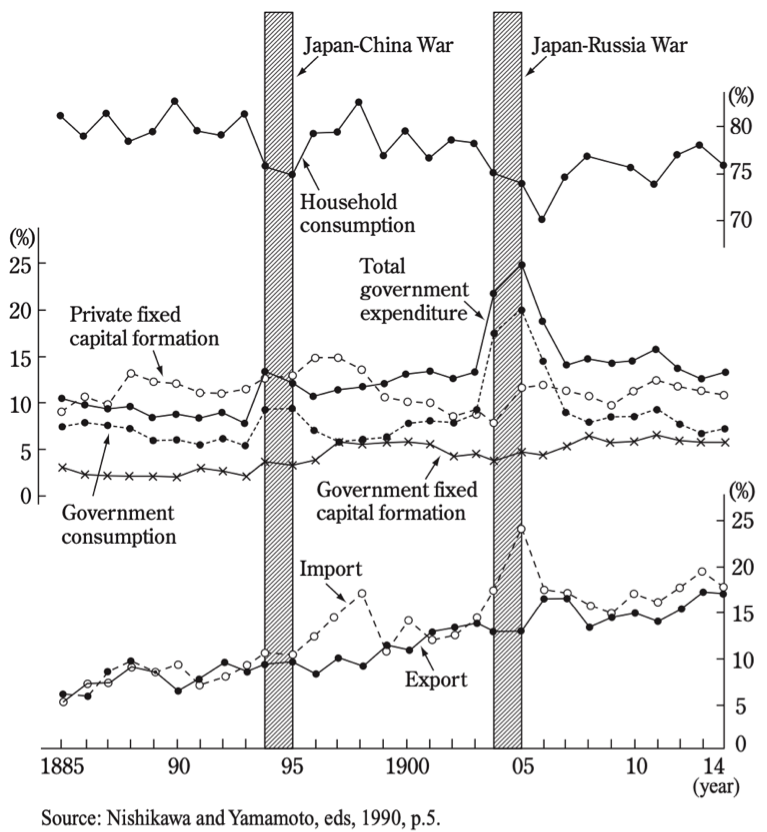 Low government spending in Japan continued in the post 1945 period, with the size of government averaging only around 20 per cent of GDP at a time when, in most other industrialised nations, it was 30 per cent plus. In addition to this avoidance of disincentives to work and enterprise through low taxes and spending, Japan’s strong growth was founded on very high levels of domestic savings and investment. This continued into the 1930s and commenced again in the post 1945 period when Japanese domestic savings accounted for some 40 per cent of GDP up until the 1980s, at a time when domestic savings of most other industrial countries accounted for under 25 per cent of GDP.
A key component of Japanese capital accumulation was savings by households. This was propelled by interest, which was largely tax free in the primary savings institution, Post Office savings bank. Fiscal policies ensured that bank’s lending was largely directed to business investment. As a result, for the years to 1980 Japan achieved growth of over eight per cent a year, by which time its per capita incomes were comparable with those of major European nations. Since the 1980s when taxation “reforms” removed the low taxation on income from savings, Japan’s savings rate and its economic growth have both fallen.
Savings and their allocation to productive investment is the key ingredient of economic growth. In the Soviet Union of the 1920s and 1930s this was achieved through forced collectivisation of farming and essentially expropriating the value of peasants’ incomes, allocating them to the development of heavy industry. Stalin’s policy drove Russia into a passable level of industrial output, albeit at colossal cost of human lives and suffering and with a stultifying bureaucratic legacy. Russia’s bureaucracy eventually proved unequal to the task of permanent innovation and cost cutting that is inherent in competitive market based economies.
The model of small government, high savings (plus the rule of law) was later followed by the “Asian tigers” Hong Kong, Singapore, Taiwan and South Korea with spectacular growth rates similar to those of Japan.
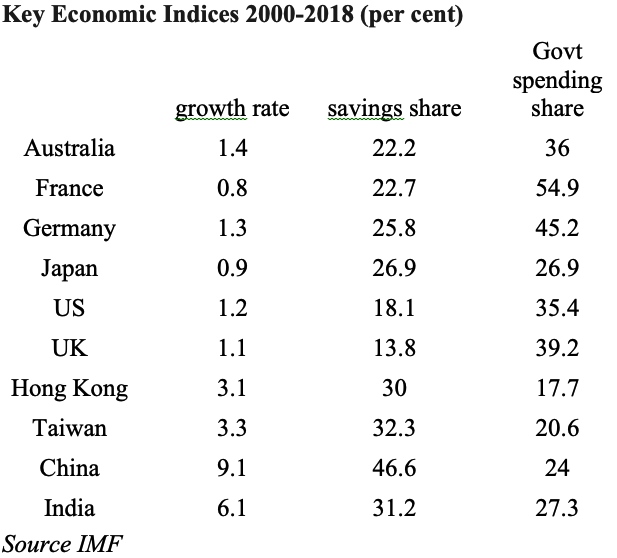
 The economic surge of the “Asian Tigers” in the late 1980s, was followed by the rapid emergence of China, which, inspired by their success, adopted its own version of capitalism, reintroducing secure private ownership and permitting free enterprise and seeing savings rates that surpassed those of any previous nation embarking on economic take-off. Comparative indices of developed and developing countries are illustrated below.
 One policy set that characterised England (and later Germany and the US) in their most rapid growth periods was trade policies that today would be characterised as protectionist. Japan also followed such protectionism and, indeed, the only success story that totally rejected it was Hong Kong.
Australian perspective
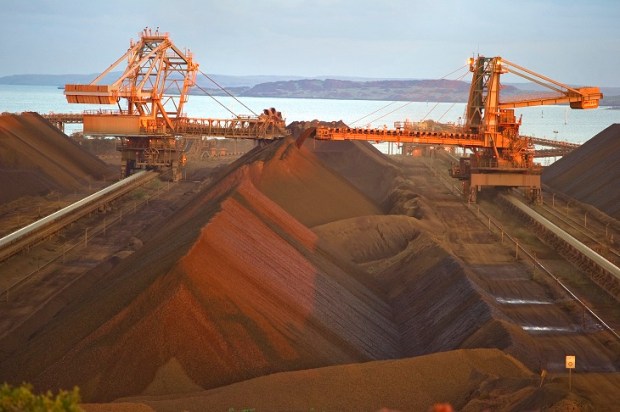
Australia prides itself as having achieved more solid growth over the past 30-40 years than most of other developed countries but that growth is hardly spectacular and is fuelled by our having been well situated to become the source of raw materials for the Asian growth stories.
Australia has an ostensibly smaller government share of government within the economy than that of other countries but comparisons may be distorted by the federal system and by national superannuation which is a different treatment of old age pensions than that of other countries.
Australian government spending tends to be ratchetted up by Labor administrations with the measures not being fully reversed by conservative administrations. The more recent of these have been new policy spending initiatives in education and for people with disabilities.
There is also a mounting hostility to growth by The Greens and to some degree the ALP in political decision-making and this has resulted in growth-inhibiting regulatory policies including:
- Hostility to the development of and eagerness to tax coal, gas and other resources, which are the nation’s most important exports
- Determination to ensure the destructive substitution of high cost, unreliable wind and solar for low cost reliable coal for electricity generation
- Measures that restrain the use of water for farming in Australia’s most important agricultural province, the Murray Darling, and in building new irrigation facilities and preventing land clearing in Queensland
The speed with which the ALP agreed with the Coalition’s proposed de facto subsidy to new home owners in the last week of the May 2019 election campaign, underlines the message that the ALP will never be outspent in election promises by the Liberals. Future policy initiatives by an ALP government suggest a new level of spending and taxing and regulatory measures with the latter focused on corporate incomes and individual savings. Using the intended ALP tax regime and plausible assumptions about inflation, Ergas and Pincus estimate the tax rate on individual savings comes out at 55-77 per cent.
Above all there is climate and energy policy, about which, journalist Chris Kenny said, “the Coalition can’t bring itself to respond (to the ALP’s contention) that there is no cost to inaction; presumably because that might expose the folly of heavy costs already imposed by its climate policies”. Those policies involving subsidies to renewable energy and discouragement of fossil fuel developments in the case of the Government were estimated by Fisher to cost $89 billion by 2030; those of the ALP were costed at $400 billion.
In both cases there are almost certainly far greater costs than Fisher’s estimates as a result of them undermining the nation’s previously low-cost domestic energy supply via taxes. In addition, the ALP policies would further squeeze agricultural output by reducing the availability of water for irrigation and preventing the clearing of land for cropping and grazing.
Many confusedly associated the formidable achievement of Japan with a supposed “winner picking” policy followed by MITI. In fact, although indicative planning notions were prominent in political statements, there were no policy levers to allow any such plans to prevail. Indeed, contrary to stated MITI policies, consumer electronics and car firms like Honda established themselves (see Tresize, P.H. 1983, ‘Industrial policy is not the major reason for Japan’s success’, Brookings Review, 15 June, pp. 13-18.). Perhaps influenced by this mistaken interpretation of Japanese growth, the ALP has a planned $1 billion “advanced manufacturing fund”. The Liberals have a diluted me-too policy with a $50 million taxpayer subsidy plan. We all now seem to believe that government has the solutions for generating prosperity.
Per capita, the 25 million Australians are sitting on the most valuable natural resources in the world. As custodians, while avoiding the impasse of a Venezuelan full blooded incursion of government into the economy, we should have performed much better – after all our natural wealth is not matched by our income levels – and the pressures that have led us to performing below par in economic development are becoming more prominent.
Alan Moran’s latest book is CLIMATE CHANGE: Treaties and policies in the Trump era.
Got something to add? Join the discussion and comment below.