Digital tech turnover growth 2010-2014
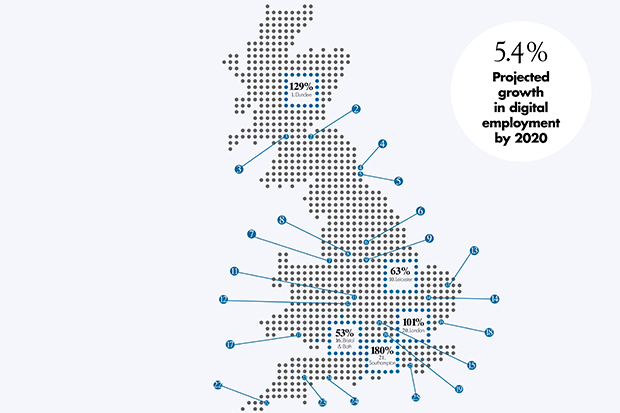
1. Dundee 129%. 2. Edinburgh 48%. 3. Glasgow 42%. 4. Newcastle & Durham 29%. 5. Sunderland 44%. 6. Leeds 47%. 7. Liverpool 49%. 8. Manchester 40%. 9. Sheffield & Rotherham 45%. 10. Leicester 63%. 11. Birmingham 17%. 12. Worcester & Malvern 48%. 13. Norwich 22%. 14. Cambridge 46%. 15. Oxford 42%. 16. Bristol & Bath 53%. 17. Cardiff & Swansea 15%. 18. Ipswich 24%. 19. Reading & Bracknell 23%. 20. London 101%. 21. Southampton 180%. 22.Truro, Redruth & Camborne 153%. 23. Exeter & Newton Abbot 41%. 24. Bournemouth & Poole 39%. 25. Brighton 17%
BRITAIN’S UNICORNS
43%
of all European ‘unicorns’ (companies with $1bn dollar valuations) are based in the UK.
JOBS IN TECHNOLOGY
3.2m
There were 3.2m jobs in the UK’s high-tech economy in 2013, according to Nesta: 2.4m jobs in high-tech industries, 825,000 in Stem (science, technology, engineering and maths) occupations and 1.6m in other roles, plus another 806,000 Stem roles outside high-tech industries.
FUTURE GLOBAL MARKETS 2025

$53bn
Synthetic biology and non-animal technology

$200bn
Sensors

$98bn
Robotics

$1.9tn
Internet of things

$260bn
Cyber security

$20bn
Quantum technologies

$11bn
Energy harvesting

$29bn
New imaging technologies
UK R&D spending 2014
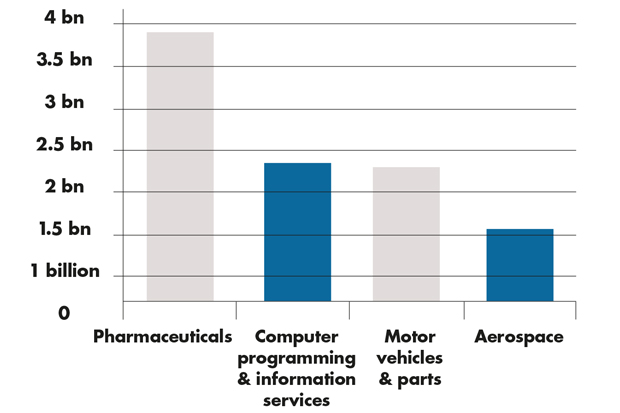
£19.9bn
Total spending on research and development in the UK in 2014 — up 5% on the year before. (ONS)
14,000
Number of jobs in the UK directly linked to R&D investment, including 9,000 scientists and engineers.
UK digital start-ups
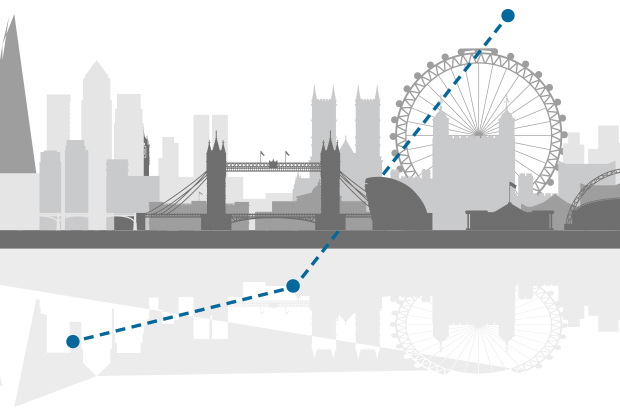
92%
There was a 92% rise in new digital firms set up in inner London from 2010 to 2013.
London tech firms secured almost $1.4bn in venture capital financing in 2014, double the figure for 2013 and 10 times that for 2010.
The post Technology by numbers appeared first on The Spectator.